The Big Mac Index (BMI)![]() , was introduced by The Economist in 1986 to “make exchange-rate theory more digestible” — tracking the over- and under-valuation of each currency against the dollar. The Big Mac Index was based on Purchasing Power Parity (PPP) Theory that a particular amount of dollars should be able to buy an identical basket of goods in each country. And that basket of goods here is the Big Mac.
, was introduced by The Economist in 1986 to “make exchange-rate theory more digestible” — tracking the over- and under-valuation of each currency against the dollar. The Big Mac Index was based on Purchasing Power Parity (PPP) Theory that a particular amount of dollars should be able to buy an identical basket of goods in each country. And that basket of goods here is the Big Mac.
If a country’s dollar price of a big mac is less than that of the United States, it means that the country’s currency is undervalued against the dollar. For example, in July 2014, $4.80 buys a Big Mac in the United States, while $2.73 buys one in China. Therefore, the yuan is undervalued by 43.13% ((2.73-4.80)/4.80*100%=-43.13%) .
McDonalds’ Big Mac is produced nearly in the same manner and held to the same standard in more than 100 countries, thus the index makes comparing many countries’ currencies possible.
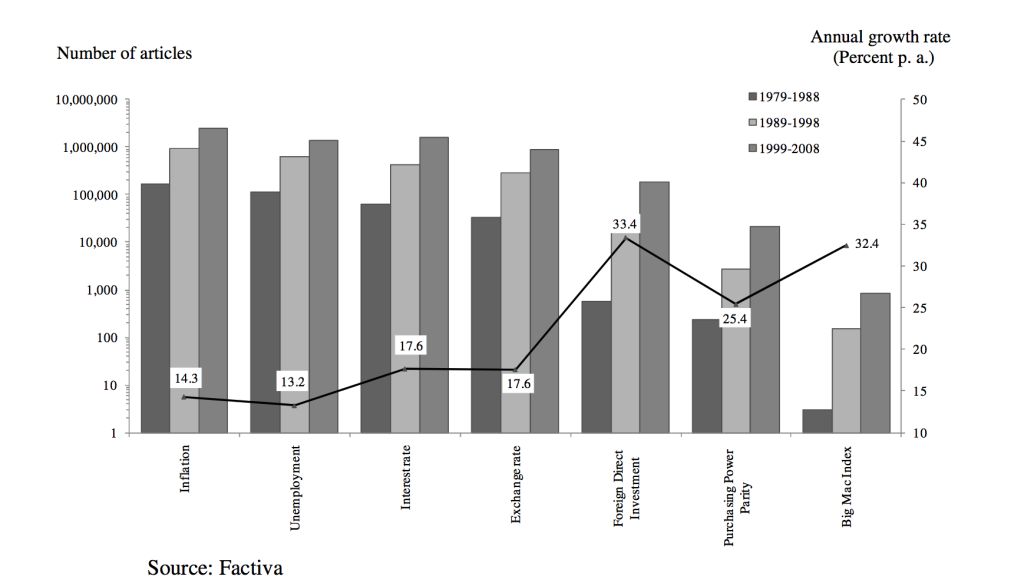
The BMI has been a heated topic with one of the highest annual growth rates among other popular economic indicators since it was introduced.
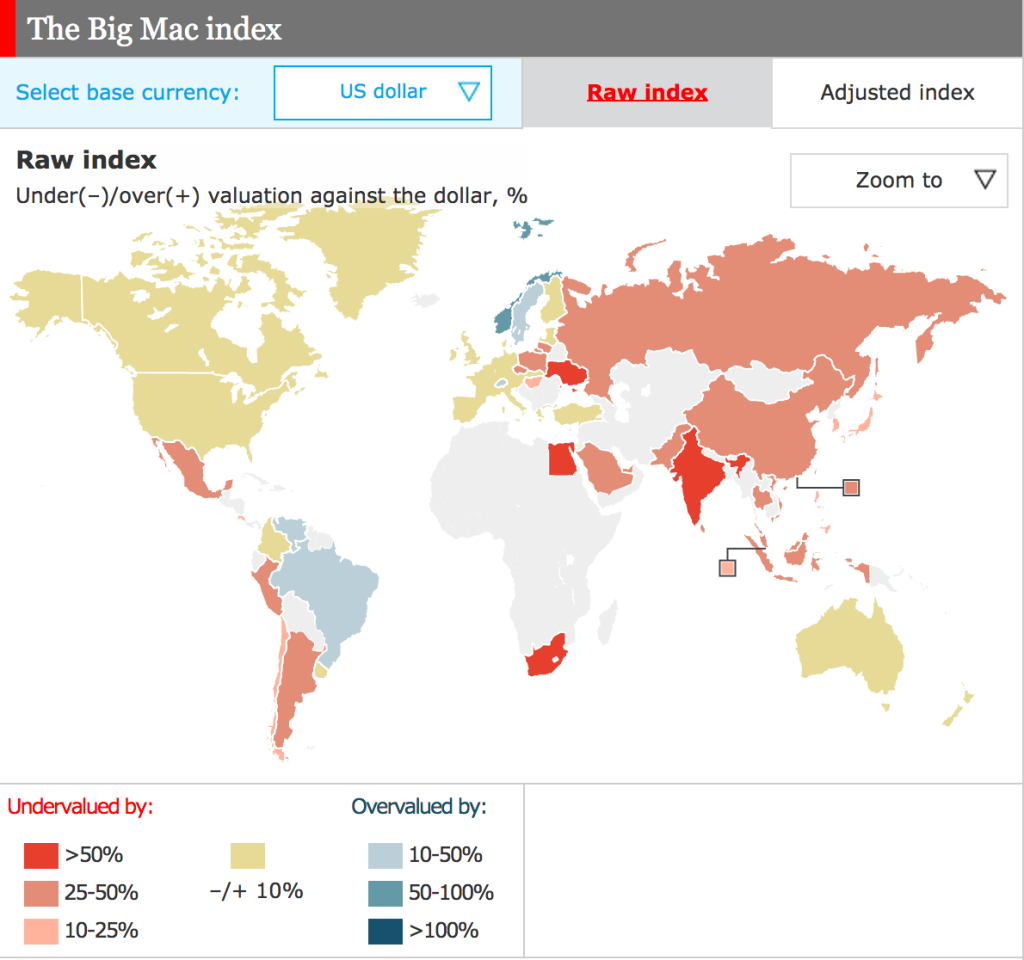
In the map above, Asia is the cheapest place to buy a big mac — Asian countries’ currencies are undervalued while European countries’ are overvalued. In 2014, the most undervalued currency is Hryvnia, undervalued by 66.09% against US dollar, and the most overvalued currency is Kroner, overvalued by 61.79%.
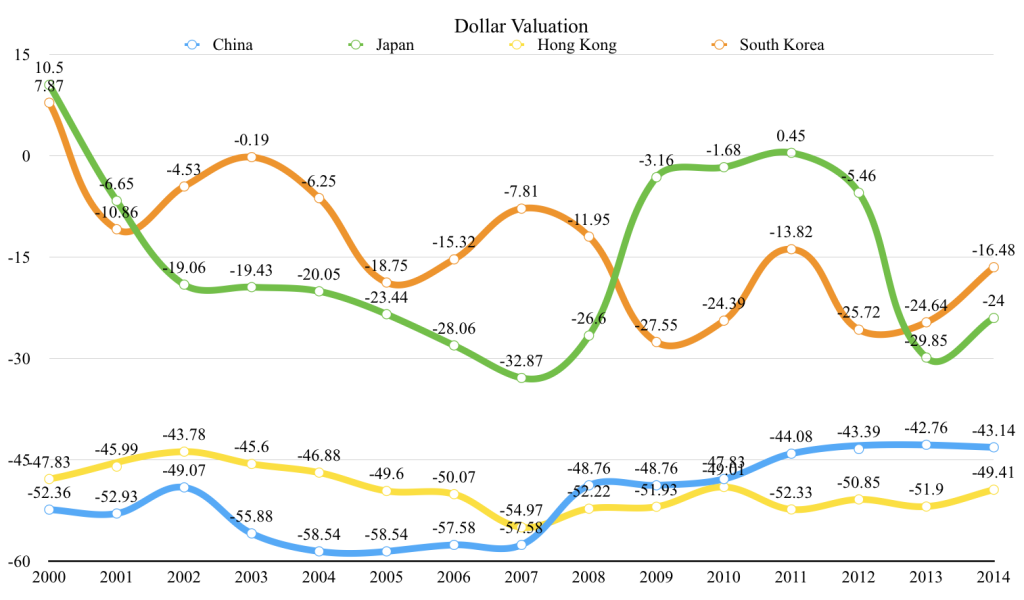
The table above indicates the trends for the four East Asian currencies tracked consistently from 2000 to 2014. South Korea is still in as big an upheaval as it was ten years ago. It began with a valuation 7.87% above the dollar and ended up with a valuation 16.48% below the dollar with some ups and downs in between. The yen has had a bumpy ride too.
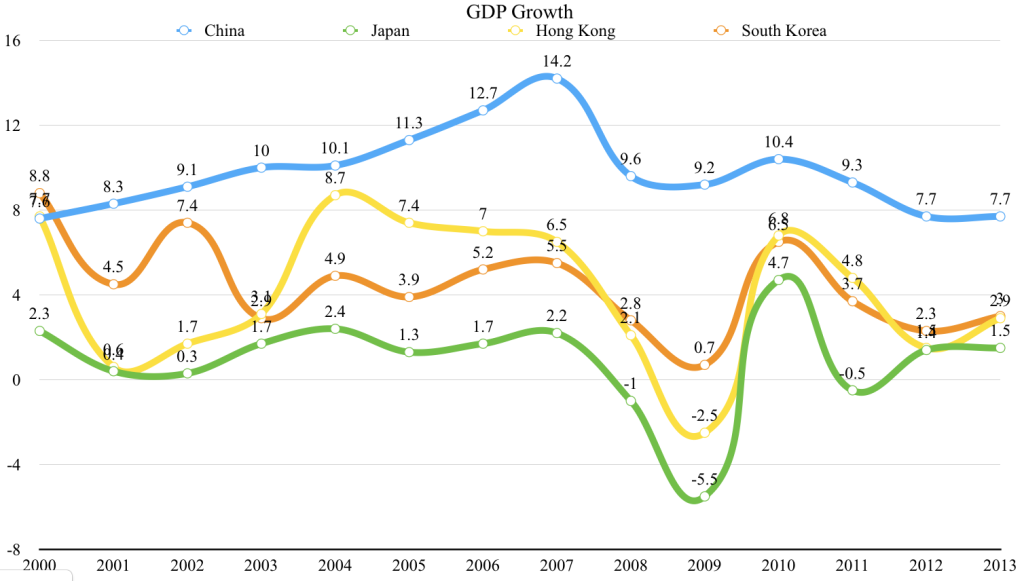
After being pegged to the dollar for more than three decades, the won became a floating currency in 1997. Also in 1997, South Korea was confronted with Asian Financial Crisis and the region’s currency depreciation (other three biggest victims are Thailand, Malaysia, and Indonesia). 1997 is one of the watersheds — the won’s BMI curve had been comparatively gentle by the end of 1997 but it dramatically plunged from 1996’s 25% to 1998’s -31%. After the IMF bailing out the country in 1998, South Korea ushered in a moderate economic growth. 2008 is another watershed. Influenced by the global economic crisis, the won ‘s BMI experienced a downtrend from -7.81% to -27.55%. More evidently, the won’s BMI curve goes hand in hand with South Korea’s GDP growth, sharing a precisely synchronized rise and fall.
Hong Kong dollar and Chinese Yuan have remained relatively steady over the last 14 years. Hong Kong’s relatively smooth curve (47.83% undervalued in 2000 to 43.14% undervalued in 2014) can be explained as “Hong Kong dollar is tied to the American dollar”.
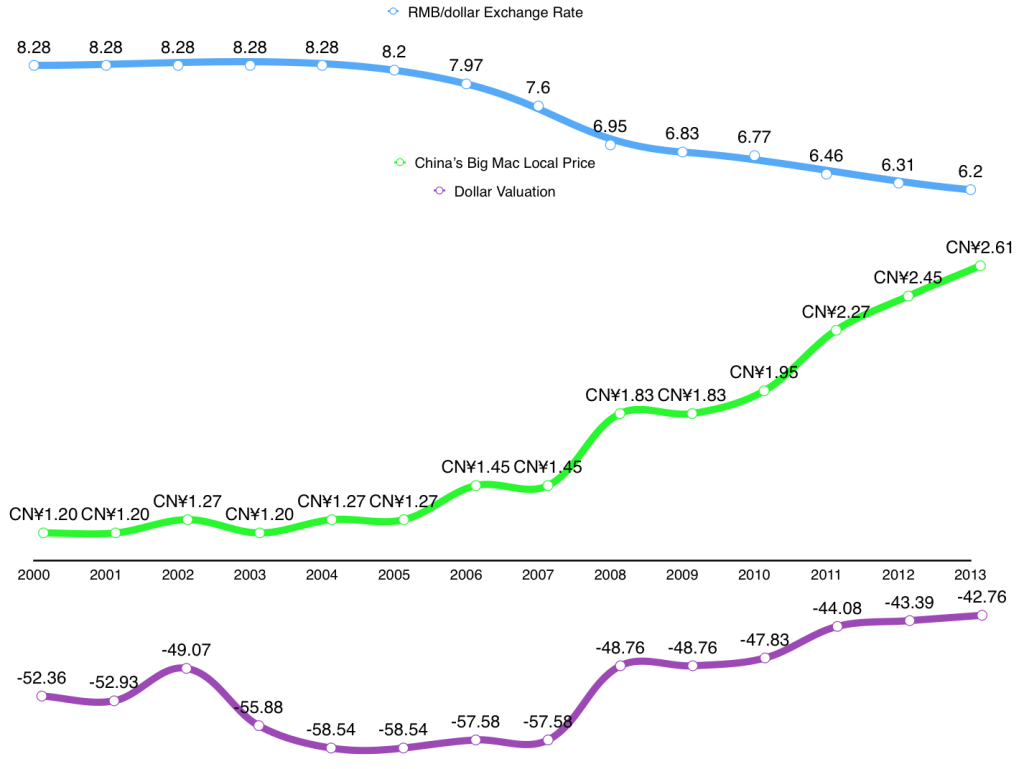
How about China? Its relative stability (52.36% undervalued in 2000 to 43.14% undervalued in 2014 with little movement in between) might be partly attributed to the steady economic growth even during the crisis.
The Big Mac Index also reveals the rise and fall of the currency’s value under the mask of a Big Mac’s unvaried local price and exchange rate. Taking Chinese Yuan as an example, the exchange rate and the average local price of one Big Mac almost remained unchanged from 2000 to 2004, but the BMI implies that the yuan was undervalued to a varying degree during that period. The relation between BMI and RMB/dollar exchange rate has become more reasonable since 2005, because RMB/dollar exchange rate was tuned to be more “natural” by the Chinese government in 2005. This can be further explained by China’s changing currency policy.
In 1994, the Chinese government announced an initial RMB/dollar exchange rate of 8.70, which was raised to 8.28 by 1997 and remained constant until 2005. In 2005, the Chinese government modified the RMB’s exchange rate to become “adjustable,” adjusted from 8.28 to 8.11. China then halted its currency appreciation policy from 2008 to 2010 in response to the global economic slowdown, RMB being pegged to the U.S. dollar for roughly two years. In June 2010, Chinese authorities allowed the exchange rate to appreciate answering to market forces’ call.
Like any other economic indicator, the BMI has limitations. First of all, due to the different social status of fast food in different countries, the selected item may not be representative enough to see the whole picture of the country’s economy. Second, Big Macs are produced in various sizes with different ingredieants, and McDonald’s even use different commercial strategies around the world, which would result in a “non-identical basket” of goods.
With the popularity of the BMI, some similar indexes came into being. The alternative indicators based upon PPP Theory are iPad Index and iPod Index.

Leave a Reply
You must be logged in to post a comment.