Durable Goods Orders, a Barometer of Economic Confidence

The Advance Report on Durable Goods Manufactures’ Shipments, Inventories and Orders is a monthly report released by U.S. Census Bureau, part of which indicates dollar value of new orders of durable goods made by more than 4,000 manufacturers. These goods are expected to have a useful life of at least three years and higher prices. They include defense aircraft, automobiles, furniture, computer equipment and etc.

Businesses are not doing that purchase so often. Once paying a huge amount of money, manufacturers are expecting a long useful life from these goods and showing confidence in the economy, otherwise they will held the decision until the economy is promising enough.

The orders of durable goods placed by manufacturers can cause a chain of economic changes. Since the durable goods are often purchased to replace the old ones or as supplements, a higher efficiency and more supply can be expected. As supply produces it’s own demand, consumer purchase usually rises while manufacturers providing more goods. Workers in the supply chain will have more working hours and lead to the change of non-farm payrolls. In a long run, when the supply-and-demand balance has been affected, it will further place an influence on inflation or deflation.

Similarly, shipments of orders will increase the need for transportation businesses. In addition, the change of shipment/inventory ratio will also affect the supply-and-demand balance.

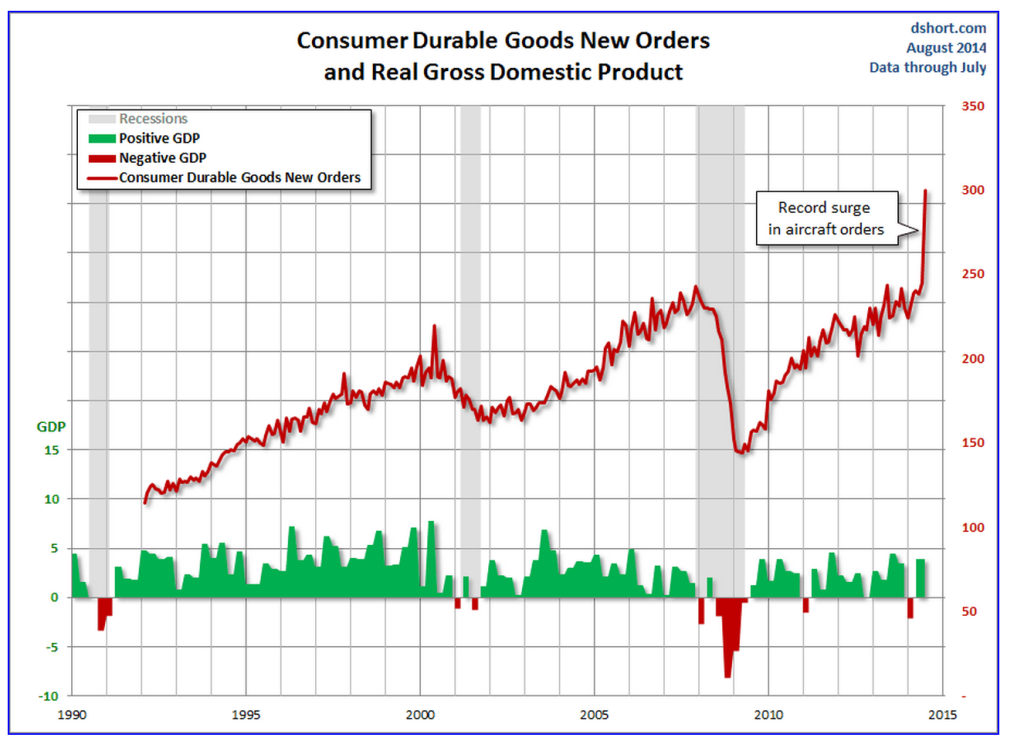
The index of durable goods orders has long been used as an important barometer of economy. As the graph below shows that the Durable Goods Orders are correlating to the changes happened to GDP.

Consumer Durable Goods New Orders and Real Gross Domestic Product

Consumer Durable Goods New Orders and Real Gross Domestic Product

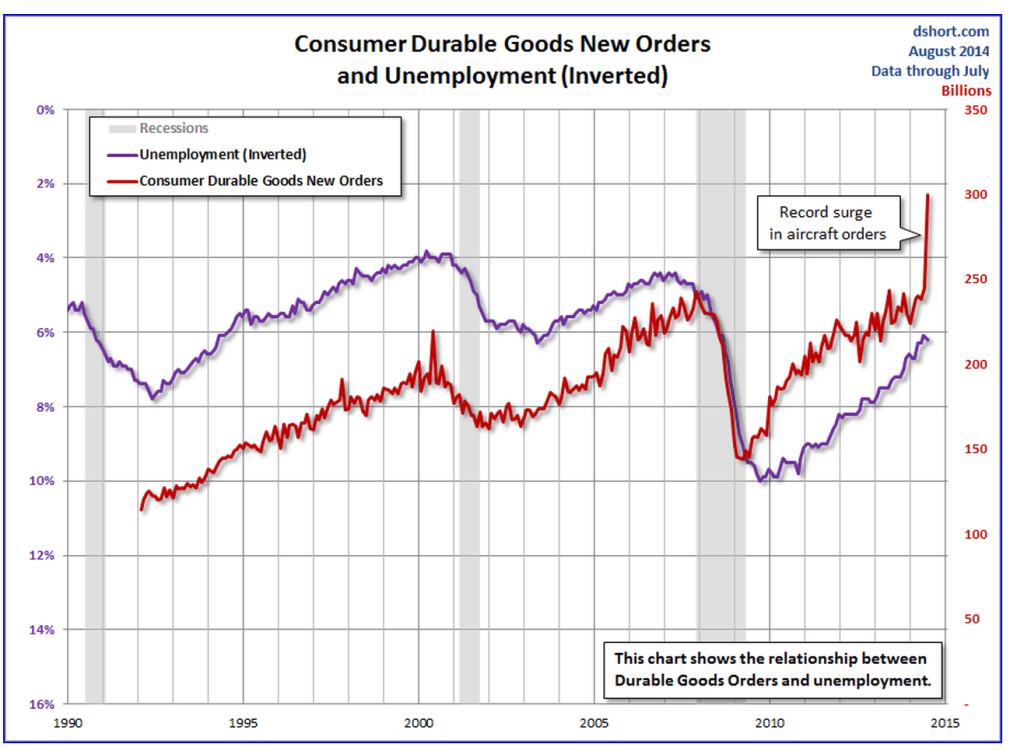
When the unemployment rate is reverted, it shows correlations to durable goods orders. It’s easy to find that durable goods orders usually drops earlier than the upcoming recessions, while the unemployment rate will lag the rise of durable goods orders after suffering from the hard times. As a result, the durable goods orders indicate the confidence in the economy and often predict significant economic changes.

Consumer Durable Goods New Orders and Unemployment (Inverted)

Consumer Durable Goods New Orders and Unemployment (Inverted)

The data of durable goods orders are collected and released month by month, so it’s a timely feedback and indicator for many to make their right investing decisions.

Despite all the strengths, durable goods orders are volatile due to some unexpected purchases made for transportation and defense.

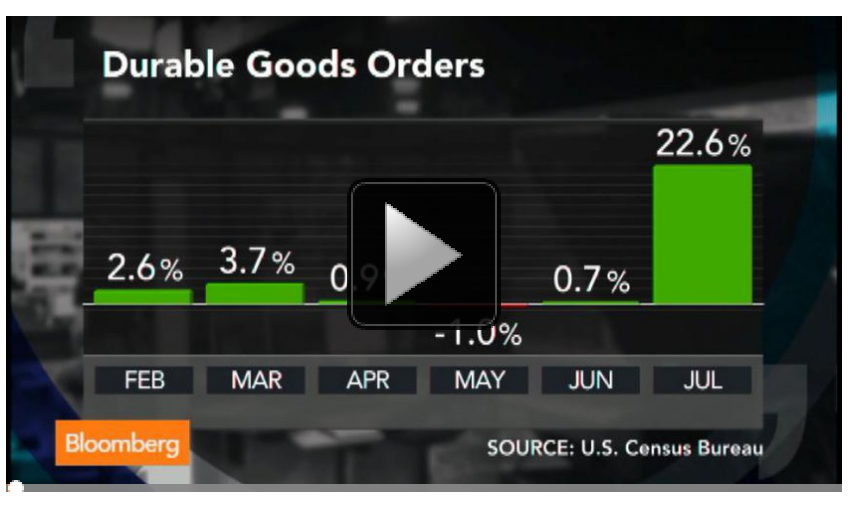
For example, according to the U.S. Census Bureau, orders for manufactured durable goods in July has increased $55.3 billion or 22.6 percent to $300.1 billion. But this surge mainly comes from bookings for civilian aircraft. Boeing has said that it received 324 aircraft orders in July. The following news from Bloomberg shows how the unexpected orders affected July’s Durable Goods Orders.

Screen Shot 2014-09-03 at 1.37.45 PM

So “excluding transportation, new orders decreased 0.8 percent. Excluding defense, new orders increased 24.9 percent” for July.

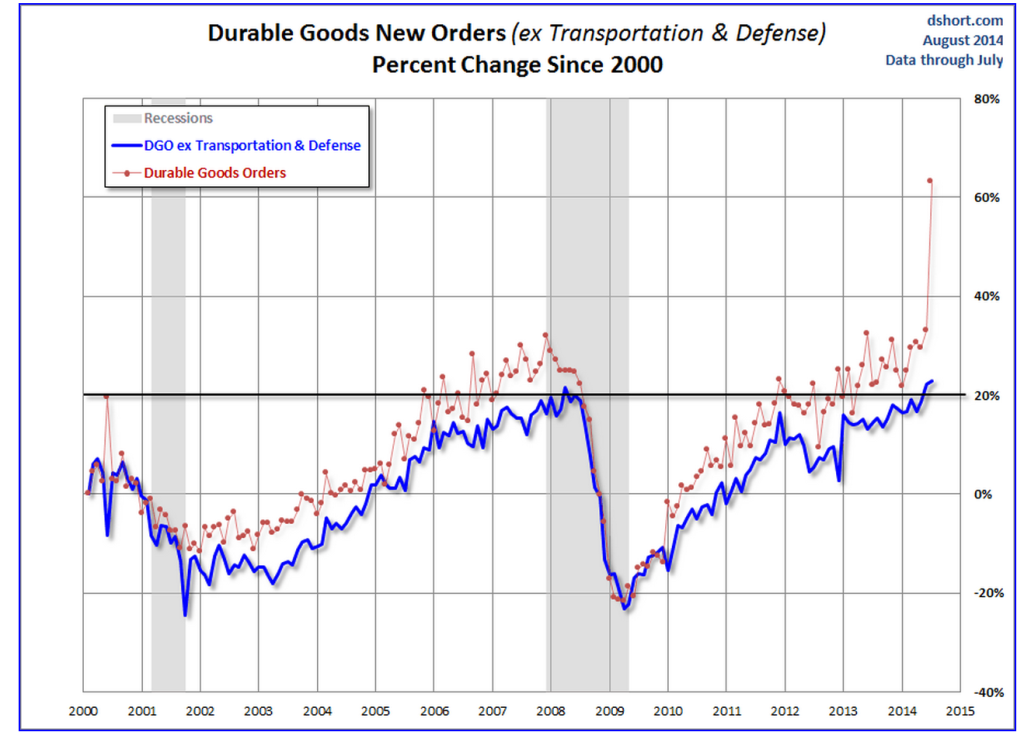
Therefore, when making predictions, defense and transportation orders are often leave out. The graph below, contrasting durable goods orders with those excluding transportation and defense, shows the substantial volatility of transportation and defense.

Core Capital Goods New Orders (ex Transportations &Defense) Percent Change Since 2000

Core Capital Goods New Orders (ex Transportations &Defense) Percent Change Since 2000

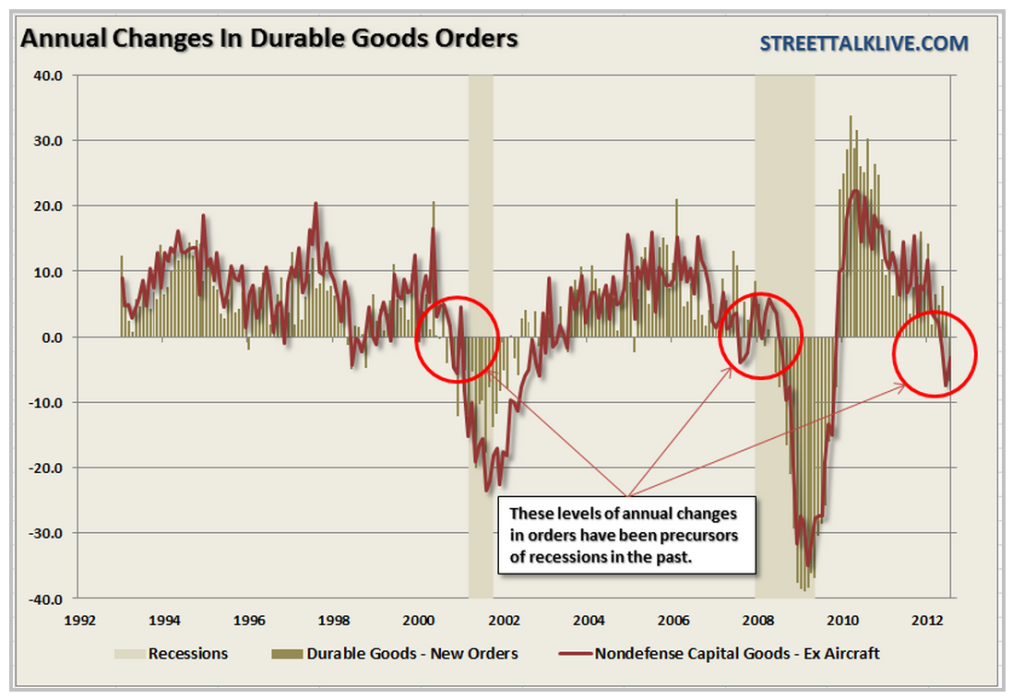
As a result of the constantly fluctuating and unexpected orders from transportation and defense, the number for a particular month may not wisely suggest the change for the whole market. While, the annual changes may be more worth noticing.
Screen Shot 2014-09-03 at 11.55.52 AM

Annual Changes In Durable Goods Orders

Embrace Recessions, Hollywood!

Screen Shot 2014-09-03 at 4.00.25 PM

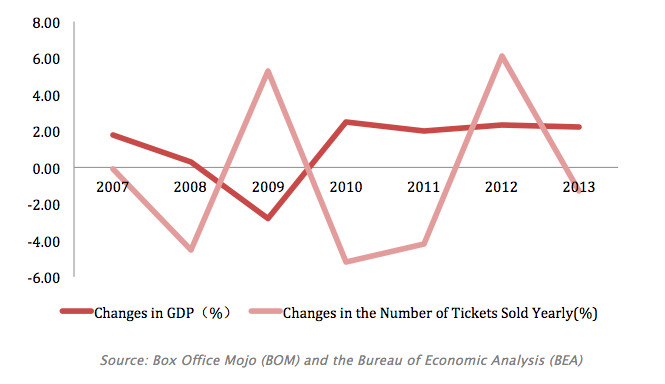
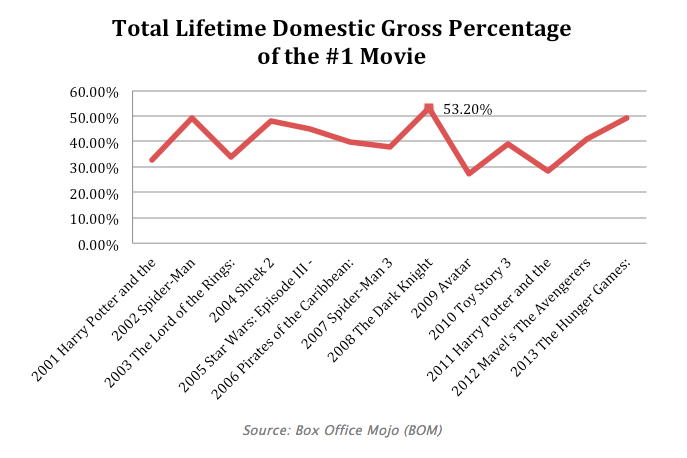
History tells us that recessions and Hollywood is like Oreo and milk – the perfect combination. Why? The above graph shows yearly changes in Gross Domestic Production (GDP) compared to the previous year and the number of movie tickets sold in the U.S in recent years. We can easily tell that, in most cases, consumers’ desire for movies is negatively correlated with the general economic environment. Namely, when people are “rich,” they’re more likely to splash out in town; while “they lose where they are, they go into the movie,” said Jeanine Basinger, a film historian and chairwoman of the film studies department at Wesleyan University in Connecticut.

Screen Shot 2014-09-03 at 4.00.34 PM

Surely there’re exceptions, but Box Office doesn’t depend solely on GDP. Factors like the annual movie market situation and the quality of movies cannot be ignored. In 2008, the Great Recession began. However, from the first graph at the beginning, it seems that people didn’t go to theatres much at that time – but did they? According to Box Office Mojo, the number of movie tickets sold in 2008 was $1341.3 million, which was the lowest since 1996. But if we take a close look at statistics from the highest grossing movies in 2001 to 2013, American’s spending on The Dark Knight, the top box-office movie in 2008, has taken up 53.2% of the global market, which was the highest since 2001 – even Avatar was defeated! Perhaps the general movie quality  in 2008 was just so-so, and that was the reason why people wouldn’t watch more movies. However, no matter what reason it was, we can see that in most of the time, recessions give Hollywood kisses and hugs.

Some might argue that they watch fewer movies now than they did before recessions. Indeed, a poll conducted by Harris Interactive shows that 55% of people go to movie theaters much fewer than before. But another factor that affects box-office should be taken into consideration as well – the changes in ways of how people consume movies. At early times, people could only enjoy movies at cinemas. Then, Digital Video Disk (DVD) was invented – people could buy or rent movies to watch at home. Now, there’s Netflix!

Screen Shot 2014-09-03 at 4.00.59 PM

Netflix, Inc. is one of the top providers of on-demand Internet streaming media. It offers Hollywood another way to take a place in consumers’ life. Just take a look at how fast it’s been growing. Netflix’s revenue in 2013 was $4374.56 million, which was 28 times that in 2002. Up to the end of 2013, the number of subscribers of Netflix has reached 31.7 million. But it doesn’t stop there. Netflix has topped Q2 domestic subscriber growth targets in 2014 by 9.6%, and added another 570,000 U.S. streaming customers to the company – and counting.

“Many feel like recession still hasn’t ended,” this is the headline of a news report written by John W. Schoen on January 1, 2014 in USA Today. However, it seems that people’s passion for movies doesn’t fade even so. Maybe for a large number of people, going into “another world” by watching movies, or an inexpensive night at home with couple of drinks can be an escape, a solution or some kind of comfort against influences they get from the not-so-promising economy. Perhaps we can say that Hollywood is shelter for people to hide in, especially when they’re suffering from gloomy economic environment.

Low-wage Workers Growth versus California Economy Recovery 

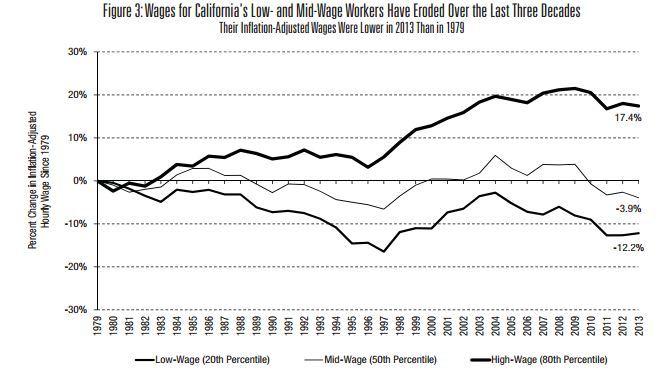
California’s decreasing unemployment rate indicated the state is slowing healing the scar by the great recession, but looking in to the average wages, a growing share of lower-age jobs sheds doubts to the sign of economic recovery in California.

According to the statistics provided by the California Budget Project, low to middle-wage workers have been paid less over the last decade. By the end of last year, low-wage workers were paid 12.2% less than similar workers paid 35 years ago, after adjusting for inflation. In comparison, high-wage workers were paid 17.4% more than similar workers made in 1979.


la-fi-economic-recovery-wages-20140829-002

Analysts forecasted that in the coming decade low-wage jobs will keep growing in the workforce market. Slow wage growth certainly shed doubts to economic recovery for low to middle wage Californians.

So what does this mean? California’s growing job market lift up the employment rate in the state and makes itself one of the fastest rates in the nation, but the growth of jobs is over concentrated in the growth of lower-wage workers. Indeed, not only California, the recovered job lost during the recession in the U.S. also comes with average of 23% less payment in the new jobs. Large percentage of low-income workers could indicate California pays less in support for higher education investments.

PICTURE1

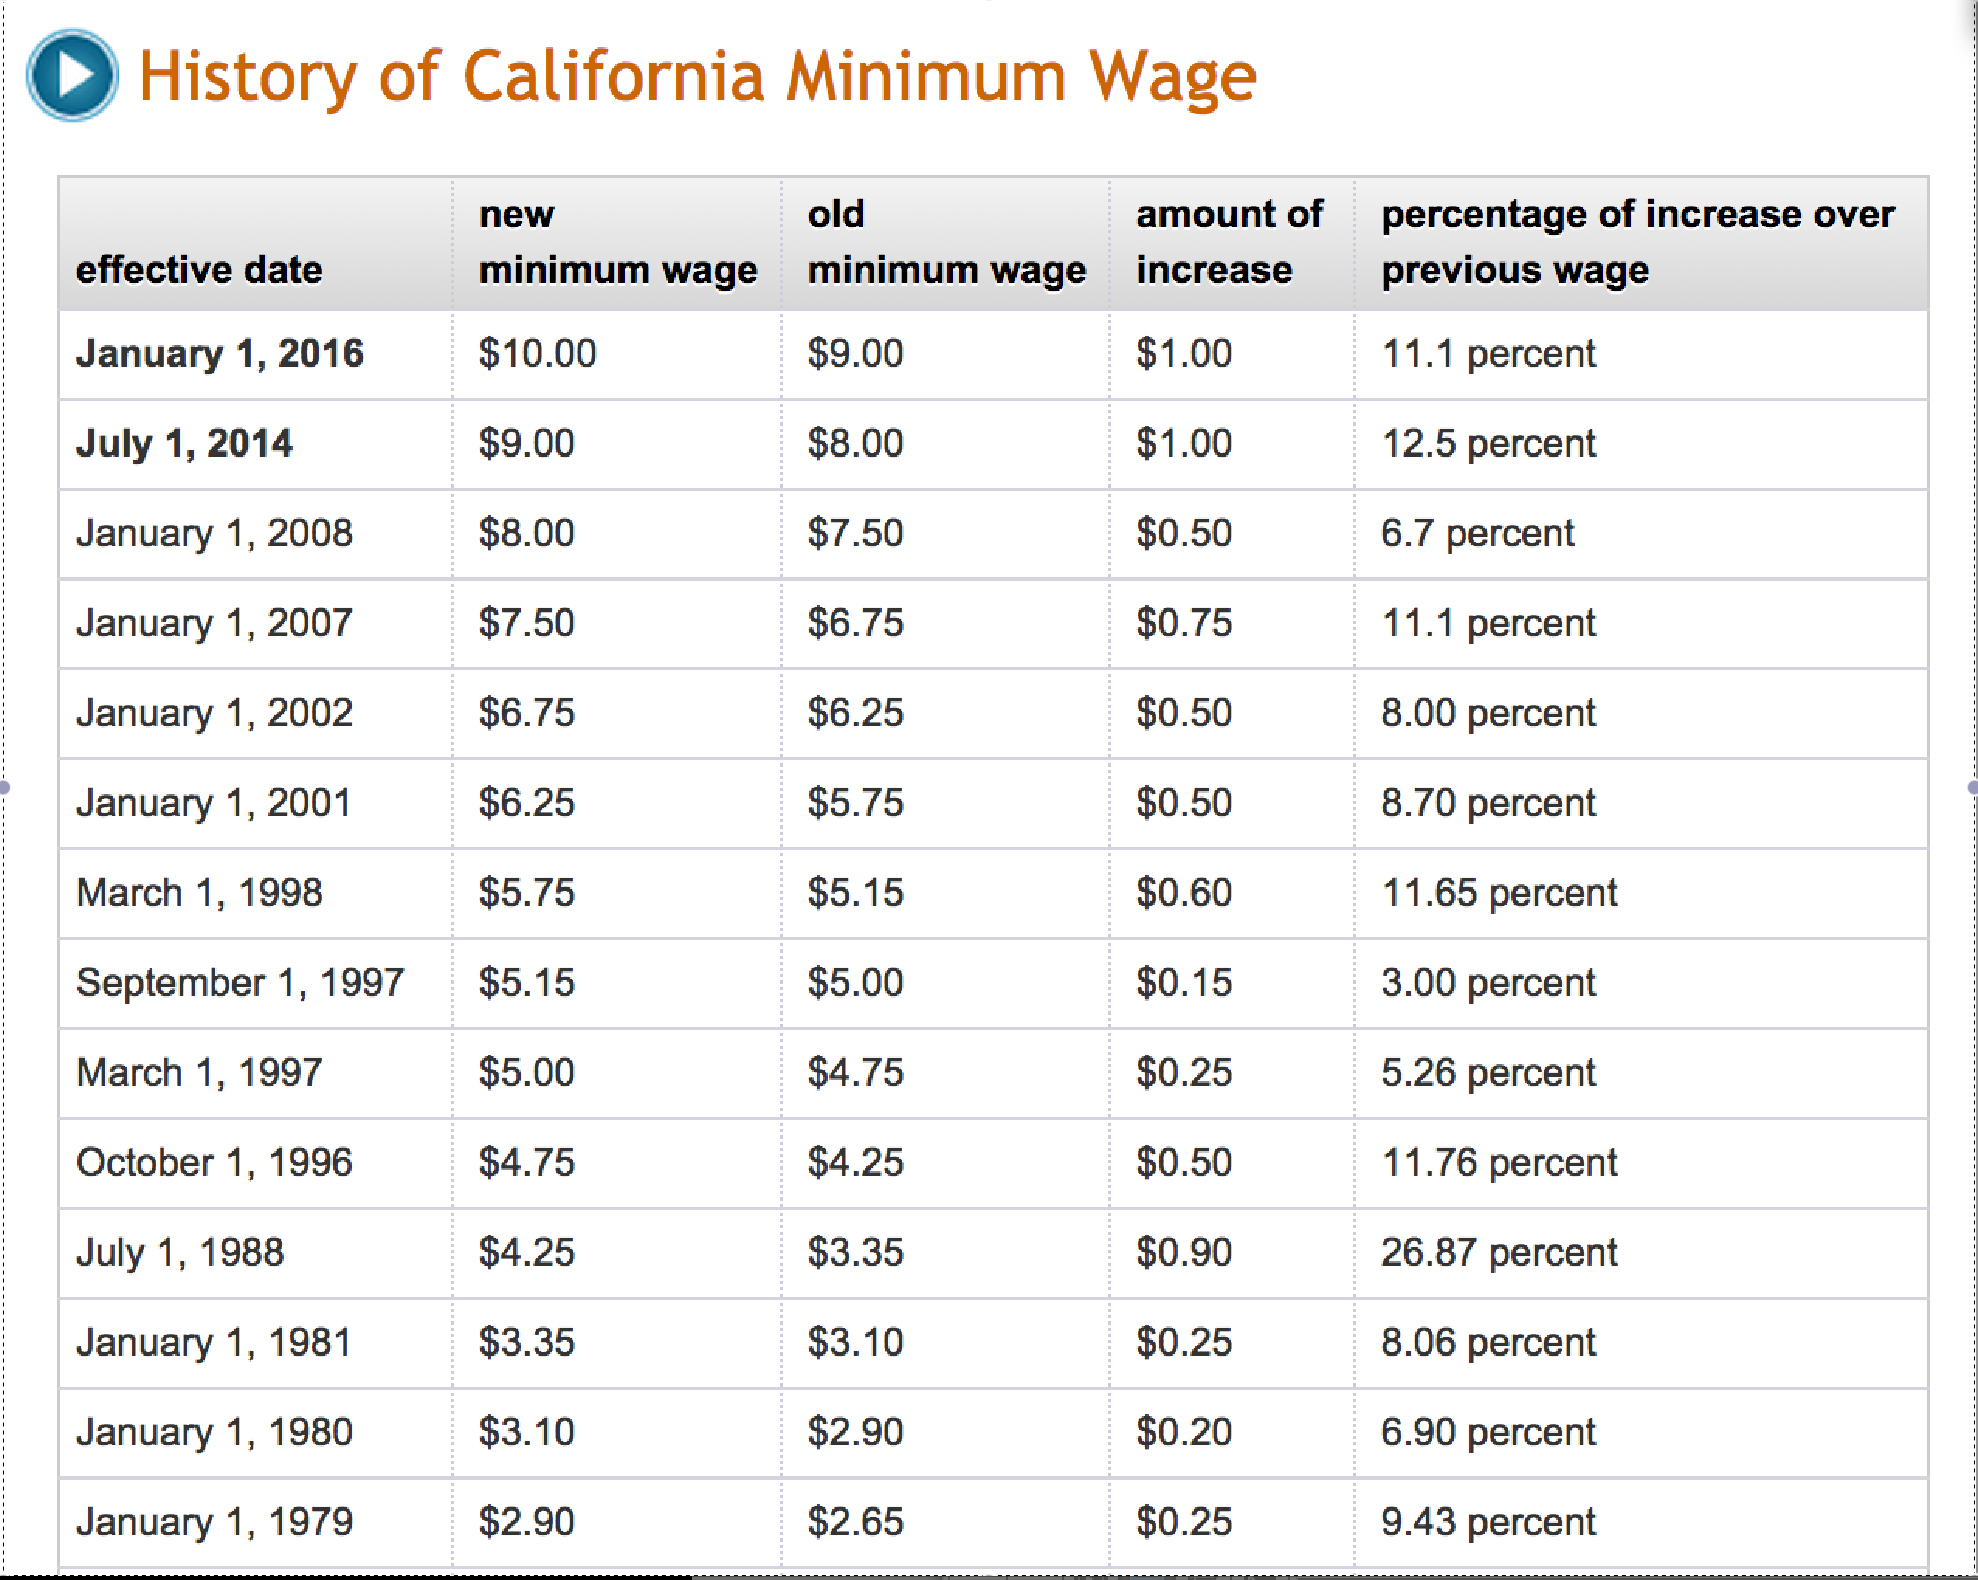
Some say that despite the increasing number of low-income workers, interestingly, the minimum wage of California has been increasing throughout decades. The current minimum wage is $9.00 per hour, far higher than $2.90 per hour in 1979. The newest minimum wage of $10.00/hour will be officiated in 2016.

However, the rising minimum wage does not necessarily indicate the diminishment of lower-income workers. Together with the increasing living expenses, people’s demand for salary increased throughout these years. Raising minimum wage is still in demand to boost the pay for low-wage workers to shrink the gap between low and high incomes. In the meantime, analysts advocate government to invest more in higher education, affordable preschool and after-school care to assist working parents.


Las Vegas as Economic Indicator

Looking to Las Vegas for signs of economic recovery might not be such a bad idea. With the 2014 NFL season kicking off this weekend, it serves as a reminder that gambling is one of the more taboo economic indicators we can look at. Casinos have been commonly thought of as “recession proof,” but they have become much more susceptible to the business cycle. Bernard Baumohl noted in his book The Secrets of Economic Indicators: Hidden Clues to Future Economic Trends how true this was for Las Vegas during the recent economic malaise. “In the year before the recession, casinos on the Las Vegas Strip were raking in about $600 million each month from just gaming activity,” said Baumohl. “Those monthly revenues plummeted 25% during the economic downturn.” This makes sense, since it isn’t hard to see how gambling patterns can hint at the overall economy’s performance. When people are more confident they will have disposable income they won’t need to save incase of a rainy day, they’re more willing to blow it at a casino.


This article from Hannah Dreier of the AP last fall highlights how deadbeat gamblers becoming more willing to repay their outstanding debts is another sign things are turning around for Las Vegas casinos. Shockingly, the article notes “Las Vegas executives say people are especially likely to skip out on their gambling losses when times are hard.”


Las Vegas has followed the economic roller-coaster of the past few years, with tourism dropping from over 39 million visitors in 2007 to only 36 million in 2009. Sin City’s gaming revenue also plummeted during the same time frame, falling nearly 20 percent, according to the Las Vegas Convention and Visitors Authority. However, Las Vegas has returned to pre-2008 visitor numbers, with the city expected to cross the 40 million visitors threshold in 2014 for the first time in its history.


Giving people a place to gamble hasn’t been the only reason for the city’s comeback, though. Casinos have shifted their focus to attract customers through celebrity restaurants, fancy pool parties, and bringing in high end DJs to their nightclubs. “Las Vegas has moved away from being just a gambling town,” said Rob Oseland, president and COO of SLS Las Vegas told NBC news. “It’s about offering a broader array of products from luxury rooms to fine dining to entertainment for people who aren’t necessarily interested in gambling.”


Las Vegas is banking on the trend to continue upward, with new hotels popping up along the Strip. Oseland’s 1,600 room SLS Las Vegas opened up last month, and new hotels are expected in the coming years next to Circus Circus and the Wynn. It’s a welcome change to a city that has seen several big money casino projects abandoned following the economic downturn.


Lastly, investors have caught on to the recovery in Las Vegas as well. Wynn Resorts (WYNN) has seen its stock appreciate nearly 300 percent in the past five years, and the Las Vegas Sands Corp. (LVS) has seen its share price increase from the low teens to $63 dollars per share this week.

The Plastic Surgery Indicator – More Money, More Procedures

Plastic surgery (otherwise known as cosmetic surgery) for elective reasons is an industry that profits from the will of the people to improve their appearance by going under the knife. This type of surgery is not commonly covered by healthcare – which leaves the patient having to pay the pricey penny for a new appearance. Having disposable income to cover the costs of the surgery, and the ability to take off time from work to recover, are two important factors for this procedure – and the industry took a negative hit when the height of the recession was felt, leading to a downfall in 2009.

Screen Shot 2014-09-03 at 11.31.51 AM


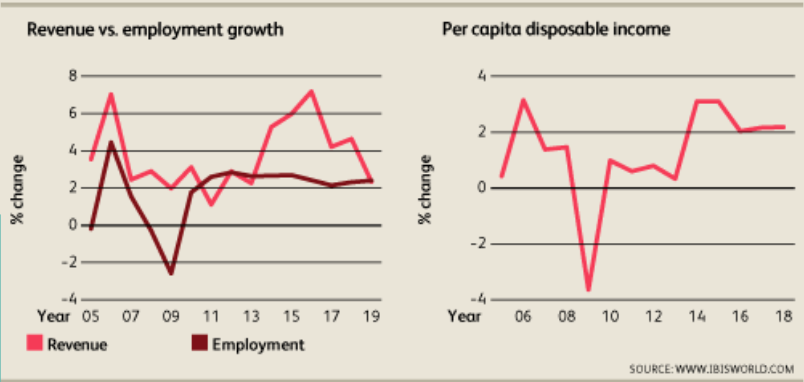
As the figure shows, the revenue of the plastic surgery industry was negatively affected from the recession, as less disposable income was available in the economy. This type of negative change proves to be an economic indicator as this type of surgery relies on the willingness and availability for the population to pay for pricey appearance improvements. As the “dominoes” game analogy would describe it, once the revenue of the plastic surgery fell down, this immediately led to the downfall of employment for plastic surgeons. Once the recession showed signs of improvement and more disposable income was available, there was a positive percent change in revenue and employment. The growth in the plastic surgery field indicated as a beneficial sign for the economy – more money to spend in plastic surgery also meant that the population was feeling confident enough to spend more money on their appearance.


As the figure shows, the growth of plastic surgery was 2.3% from 2008 to 2013; however, this number is expected to further incline as  annual growth from 2013-2018 is predicted to be 5.5%.

To understand the entire picture, it is important to consider other changes in the economy that help fuel this increase in growth. First of all, the aging population (specifically the Baby Boomers) will account for a larger portion of the population. With a large section of the population in this age group, services that the older population will desire may create a shift in demands for different industries. The plastic surgery industry will feel this change in a positive manner as aging commonly has a negative connotation in society – but paying for a quick procedure to look a little more youthful will become more of the norm.

Another factor for the positive growth is the increase in technology for less evasive plastic surgery procedures. The money that is available for this type of research is on a different pedestal versus life-saving medical technology – it doesn’t have as much priority. With this in mind, there are still vast efforts for this exploration, which indicates that there are more resources available in the economy for cosmetic purposes as well.

Plastic surgery is a growing field, and signifies the willingness and ability for consumers to pay out-of-pocket costs for appearances. As this industry has grown, so has the public perception of undergoing such surgeries to become more of a common occurrence.  Although superficial, this industry is a solid indicator of disposable income that is available for the population to spend.

Source: http://clients1.ibisworld.com/reports/us/industry/ataglance.aspx?entid=4157


A Higher Heel to Combat the Economy Downturn? – the High Heels Economic Indicator

HighHeel As the world-class luxury shoes designer Jimmy Choo said: “the right shoe can make everything different”.  It seems the high heels now are not just women’s “last touch of elegance” (quoted of legend designer Coco Chanel), but also the weapons women are using to fight against the economy recessions.

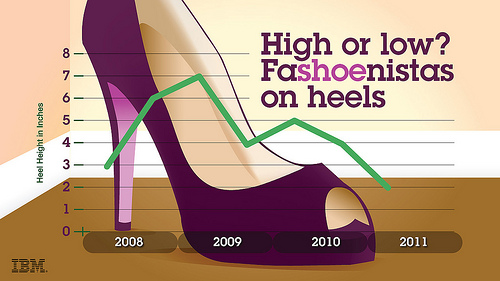
IBM conducted a computer-based analysis project on billions of social media posts about about shoe trends, heels are about to go down. The report came out at 2011. In the report, the researchers claimed that the higher the heels, the worse off the Economy would be.

“Usually, in an economic downturn, heels go up and stay up – as consumers turn to more flamboyant fashions as a means of fantasy and escape,” said Dr. Trevor Davis, a consumer products expert with IBM Global Business Services. “This time, something different is happening — perhaps a mood of long term austerity is evolving among consumers sparking a desire to reduce ostentation in everyday settings.”

According to an article published by the Christian Science Monitor from CNBC wire, the several big recessions of the U.S. Economy in history have shown the correlation between the economy status and the height of the heels.

In the 1920s, women were wearing high-heel pumps and platforms to get their confidence back during the Great Depression. In the 1970s oil crisis, platforms came back en vogue as the low-heeled sandals of the late 1960s were cast aside. In the 1990s, the low, thick heels of the “grunge” period were replaced by “Sex and the City”-inspired stilettos just as the dot-com bubble burst.

1920-1970-1990

From left to right: wall deco in 1920s; the popular platform shoes in 1970s; vintage stilettos from 1990s. 

From the report published in 2011, an analysis of the four years (from 2008 to 2011) of social media showed that discussions of increasing heel height peaked towards the end of 2009, and declined after that. For example, key trend-watching bloggers between 2008 and 2009 wrote consistently about heels from five to eight inches, but by mid 2011 they were writing about the return of the “the perfect flat”. The sky-high heels were not gone yet; rather that, as the economy has bounced back a little, the bloggers were discussing as glamwear and not for the office or shopping trip.

6351154517_74baa80950

Source: IBM

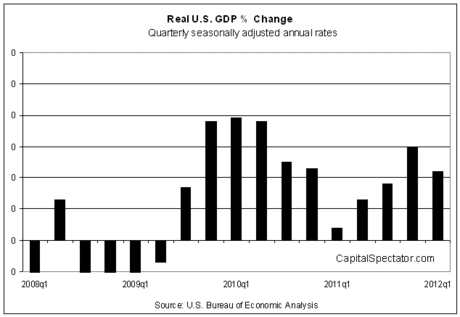
As the statistic from the U.S. Bureau of Economic Analysis indicated , from the year of 2009 the U.S. economy slowly stepped into a recovery session. The GDP grew at an annual 2.2% rate in the first three months of 2012, considerably slower than the 3.0% increase in 2011’s fourth quarter.

USGDPchange2008-2012

From the comparison and analysis for these two groups of statistics, there seems to be a kind of correlation between the economy growth and the change of women’s heel heights. Nevertheless, according to the Huffington Post, there could be other possible reasons for the dropping of heel heights.”Women may simply be ditching their heels in favor of a more pain-free walking experience, or, for once, low heels may actually indicate longer-term economic woes,” quoted from the Huffington Post’s article.

The Times Magazine responded to the newly-born High Heel Economic Index with a multimedia project: The Hazards (and Power) of Higher Heels, where the magazine tried to analyze the societal and economy reasons behind the changes of high heels.

Fashion trends have become popular economy indicators these days. Dated back to 1926, economist George Taylor came up with the Hemline Theory, which himself explained as when women wore shorter skirts to show off their expensive silk stockings during good economic times, but longer hemlines were more preferable to cover bare legs during a recession. In the 2000s, Leonard Lauder, the chairman of Estee Lauder companies, introduced the idea after noticing that lipstick sales jumped in the aftermath of 2001 terrorist attacks, according to The New York Times. He developed the scenario as the Lipstick Index, which indicated that women turn to less expensive indulgences, like lipstick, when they felt less confident about the future.

When talking about economy, people relate to numbers, analysis reports and charts. Nevertheless, something that seems not related  to economy actually has its significance for the economy prediction. And wen it comes to shoes, perhaps they will be able to tell a lot.

The Big Mac Index


The Big Mac Index (BMI)012814_0348_2, was introduced by The Economist  in 1986 to “make exchange-rate theory more digestible” — tracking the over- and under-valuation of each currency against the dollar. The Big Mac Index was based on Purchasing Power Parity (PPP) Theory that a particular amount of dollars should be able to buy an identical basket of goods in each country. And that basket of goods here is the Big Mac.

If a country’s dollar price of a big mac is less than that of the United States, it means that the country’s currency is undervalued against the dollar. For example, in July 2014, $4.80 buys a Big Mac in the United States, while $2.73 buys one in China. Therefore, the yuan is undervalued by 43.13% ((2.73-4.80)/4.80*100%=-43.13%) .

McDonalds’ Big Mac is produced nearly in the same manner and held to the same standard in more than 100 countries, thus the index makes comparing many countries’ currencies possible.

Screen Shot 2014-09-02 at 12.50.26 AM

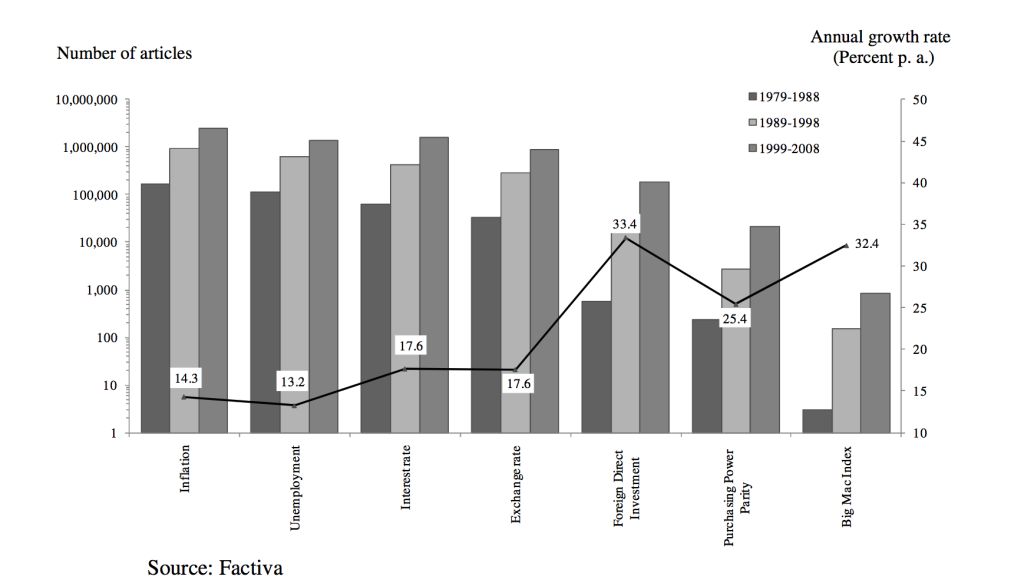
The BMI has been a heated topic with one of the highest annual growth rates among other popular economic indicators since it was introduced.

Screen Shot 2014-09-02 at 12.57.31 AM

Source: The Economist

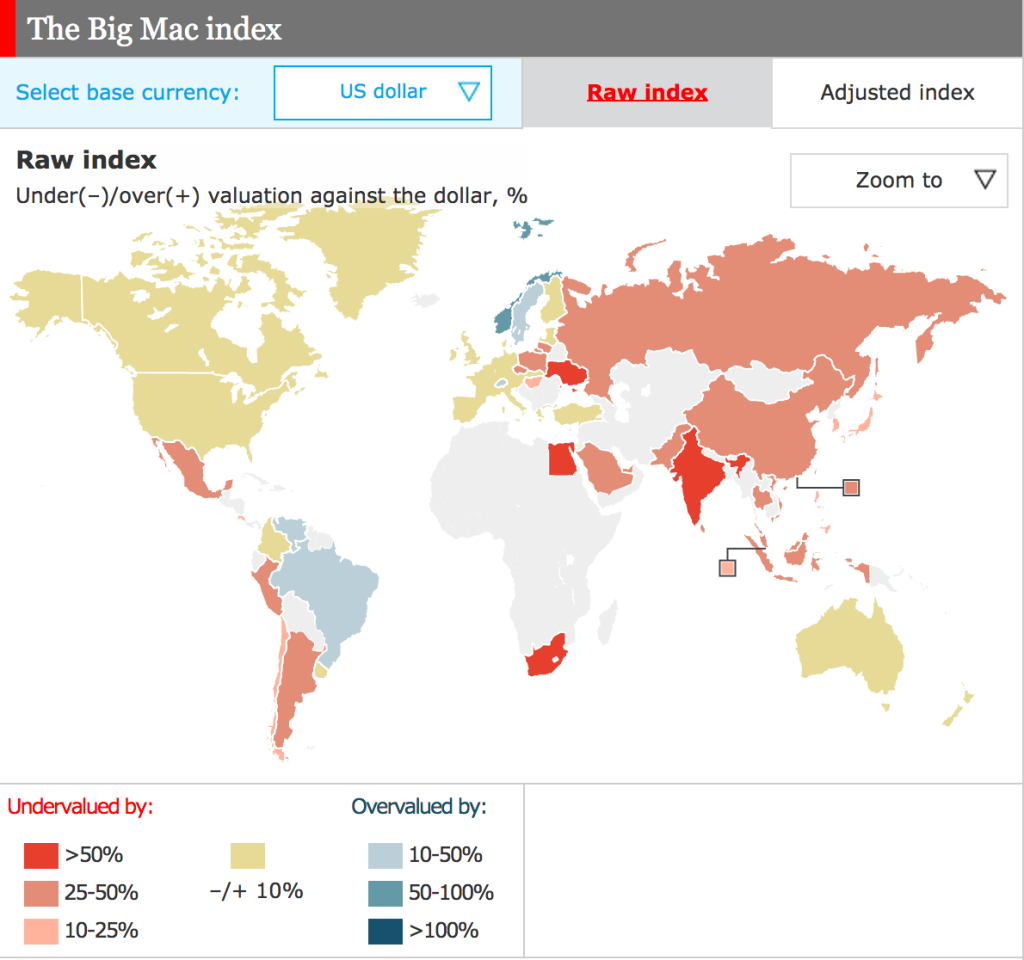
In the map above,  Asia is the cheapest place to buy a big mac — Asian countries’ currencies are undervalued while European countries’ are overvalued. In 2014, the most undervalued currency is Hryvnia, undervalued by 66.09% against US dollar, and the most overvalued currency is Kroner, overvalued by 61.79%.

Screen Shot 2014-09-02 at 2.51.26 AM

Source: The Economist

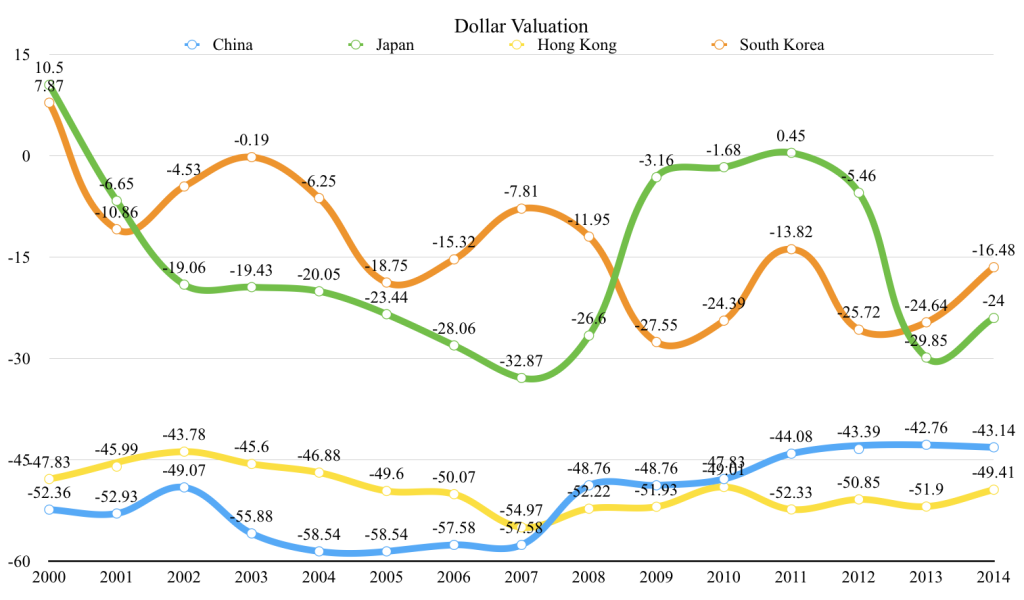
The table above indicates the trends for the four East Asian currencies tracked consistently from 2000 to 2014. South Korea is still in as big an upheaval as it was ten years ago. It began with a valuation 7.87% above the dollar and ended up with a valuation 16.48% below the dollar with some ups and downs in between. The yen has had a bumpy ride too.

The Big Mac Index for South Korea

The Big Mac Index for South Korea

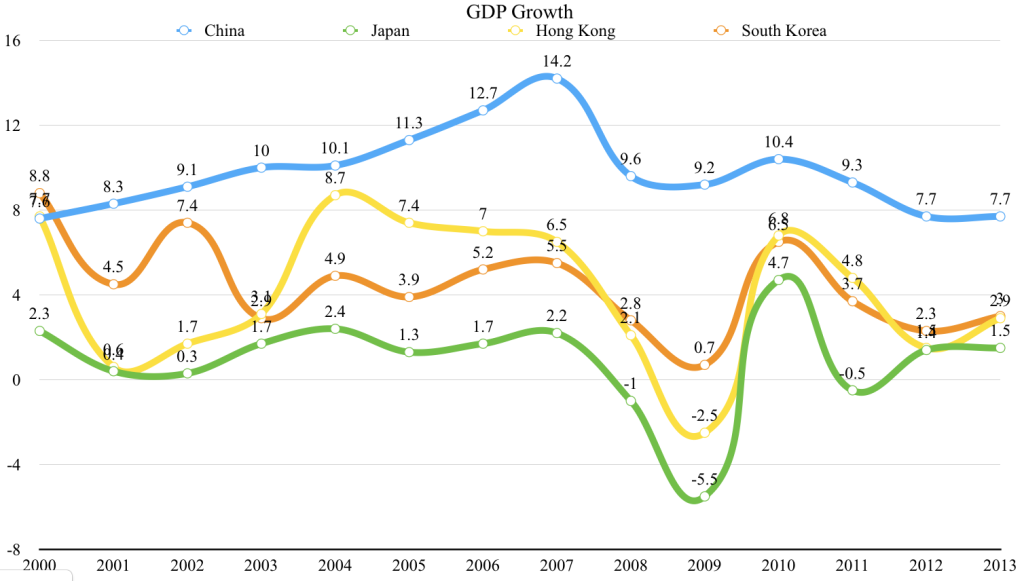
After being pegged to the dollar for more than three decades, the won became a floating currency in 1997. Also in 1997, South Korea was confronted with Asian Financial Crisis and the region’s currency depreciation (other three biggest victims are Thailand, Malaysia, and Indonesia). 1997 is one of the watersheds — the won’s BMI curve had been comparatively gentle by the end of 1997 but it dramatically plunged from 1996’s 25% to 1998’s -31%. After the IMF bailing out the country in 1998, South Korea ushered in a moderate economic growth. 2008 is another watershed. Influenced by the global economic crisis, the won ‘s BMI experienced a downtrend from -7.81% to -27.55%. More evidently, the won’s BMI curve goes hand in hand with South Korea’s GDP growth, sharing a precisely synchronized rise and fall.

Hong Kong dollar and Chinese Yuan have remained relatively steady over the last 14 years. Hong Kong’s relatively smooth curve (47.83% undervalued in 2000 to 43.14% undervalued in 2014) can be explained as “Hong Kong dollar is tied to the American dollar”.

Screen Shot 2014-09-02 at 2.51.39 AM

Source: The Economist

How about China? Its relative stability (52.36% undervalued in 2000 to 43.14% undervalued in 2014 with little movement in between) might be partly attributed to the steady economic growth even during the crisis. 

RMB

Source: The Economist

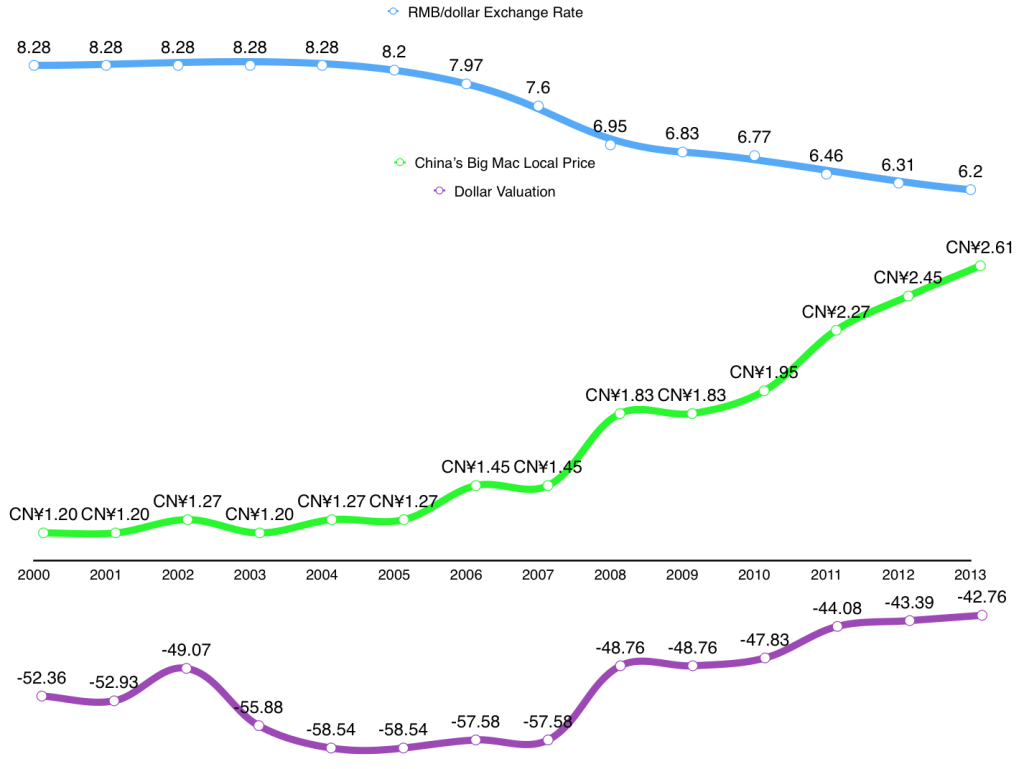
The Big Mac Index also reveals the rise and fall of the currency’s value under the mask of a Big Mac’s unvaried local price and exchange rate. Taking Chinese Yuan as an example, the exchange rate and the average local price of one Big Mac almost remained unchanged from 2000 to 2004, but the BMI implies that the yuan was undervalued to a varying degree during that period. The relation between BMI and RMB/dollar exchange rate has become more reasonable since 2005, because RMB/dollar exchange rate was tuned to be more “natural” by the Chinese government in 2005. This can be further explained by China’s changing currency policy.

In 1994, the Chinese government announced an initial RMB/dollar exchange rate of 8.70, which was raised to 8.28 by 1997 and remained constant until 2005. In 2005, the Chinese government modified the RMB’s exchange rate to become “adjustable,” adjusted from 8.28 to 8.11. China then halted its currency appreciation policy from 2008 to 2010 in response to the global economic slowdown, RMB being pegged to the U.S. dollar for roughly two years. In June 2010, Chinese authorities allowed the exchange rate to appreciate answering to market forces’ call.

Like any other economic indicator, the BMI has limitations. First of all, due to the different social status of fast food in different countries, the selected item may not be representative enough to see the whole picture of the country’s economy. Second, Big Macs are produced in various sizes with different ingredieants, and McDonald’s even use different commercial strategies around the world, which would result in a “non-identical basket” of goods.

With the popularity of the BMI, some similar indexes came into being. The alternative indicators based upon PPP Theory are iPad Index and iPod Index.

Japan shows 96.34% correlation between alcohol consumption and household income

Alcohol has never been seen as essential as the bread and milk for people’s life. But for a long time, alcohol consumption has played an important part in some country’s economy, and in some ways, helped indicate the economic growth, employment issue, and even social problems.

alcohol-pic

Alcohol has never been seen as essential as the bread and milk for people’s life. But for a long time, alcohol consumption has played an important part in some country’s economy, and in some ways, helped indicate the economic growth, employment issue, and even social problems.

Anton Reed, from Washington and Lee University, used Figure-1 demonstrating a strong correlation (79.5%) between household alcohol consumption and GDP. When GDP decreased and fluctuated afterward, in response, alcohol expenditure also decreases.

1st graph:  %change in Income and %change in Alcohol Expenditures 2nd graph: Japan's Alcohol Expenditure and Average Annual Household Income

Figure-1
1st graph: %change in Income and %change in Alcohol Expenditures
2nd graph: Japan’s Alcohol Expenditure and Average Annual Household Income

And the statistic implies more, when it touches on the drinkers, the consumers. Figure-2 reveals a correspondent increase/decrease between alcohol consumption and income. And the statistical correlation is as high as 96.34%.

1st graph: %change in Income and %change in Alcohol Expenditures 2nd graph: Japan's Alcohol expenditure and Average Annual Household Income

Figure-2
1st graph: %change in Income and %change in Alcohol Expenditures
2nd graph: Japan’s Alcohol expenditure and Average Annual Household Income

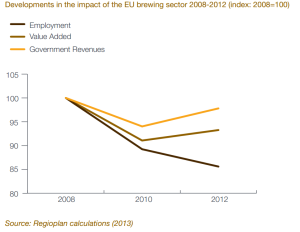
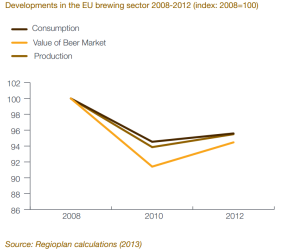
Similar results showed up in the study commissioned by the European Brewing Sector regarding beer consumption in European countries. An article named It’s a Beer Recession by Jack Ewing illustrated how unemployment rate and the European debt crisis influenced people’s drinking habit. Figure-3 shows that the EU brewing sector suffered from a severe economic downturn from 2008 to 2010, when Europe’s economy fell down under the strike from the U.S. Great Recession. People became pessimistic of European economy, and both government revenues as well as employment in brewing sector fell dramatically.

Developments in the Impact of the EU brewing sector 2008-2012

Figure-3 Developments in the Impact of the EU brewing sector 2008-2012

Along with that, in Figure-4, beer consumption decreased by nearly 9%, and the value of beer market and production also responded in the same way.

Developments in the EU brewing sector 2008-2012

Figure-4 Developments in the EU brewing sector 2008-2012

Ewing pointed out that “…the employment in the beer industry fell by 12 percent, or 260,000 jobs, the study said…Job losses can exacerbate the debt crisis because unemployed people typically collect benefits rather than pay taxes. When beer consumption declines, governments also collect less sales tax on beer sales.”

On top of Japan and European countries, China, considering its successful and tremendous alcohol market, also showed a trace of the relationship between alcohol consumption and economic growth. According to Consumer Trends: Wine, Beer and Spirits in China released by Manitoba government, off-trade* sales make up 80% of spirit sales in China, and the total expenditure increased by 7%. At the same time, the volume of on-trade spirits decreased from 2008 to 2009, because of reduced expenditure on entertainment during hard economic times.

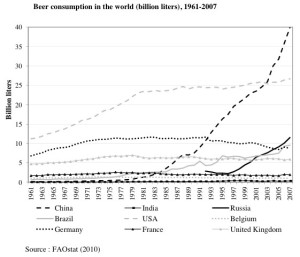
Beer consumption in the world (billion liters), 1961-2007

Figure-5 Beer consumption in the world (billion liters), 1961-2007

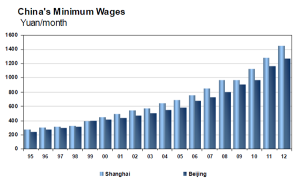
Also, Felix Salmon from Reuters showed Figure-5 demonstrating a boost of beer consumption in China, as the broken line tilts up after 1977. Comparing beer consumption after 1995 with Figure-6, the statistic reveals a corespondent increase in both values. Salmon explained that, “what we’re seeing here is largely the China effect — and, more generally, a world where poor people, once they reach a certain minimum income, start hitting the hops.”

China's Minimum Wages in Shanghai and Beijing

Figure-6 China’s Minimum Wages in Shanghai and Beijing

Thus, from the above cases, we may see that once the country is in recession, the unemployment rate goes up, then people’s drinking money shrinks, then the alcohol consumption decreases. So if people want to know how a country’s economy looks like, they may take a look at its alcohol market, unless it doesn’t have a strong culture of drinking.

For an endnote, what’s interesting but opposite to the alcohol index is that, in the U.S., alcohol consumption goes up even when the economy goes down. Michael French from University of Miami found that binge drinking increased with a rise in the state-level unemployment rate. Driving while intoxicated and alcohol abuse and dependence also increased for both genders and across ethnic groups. This has been said that alcohol index is not enough for us to peep into one country’s economy.


*On-trade = alcoholic beverages sold in restaurants, bars etc.
 Off-trade = alcoholic beverages sold in retail stores