Los Angeles rents soared as wages stagnated

Rent prices in Los Angeles County increased by nearly 15 percent over a recent period as wages remained unchanged, putting pressure on renters to find other ways to make ends meet or face potential homelessness.

The U.S. Census Bureau pegged the median household income in L.A. County at $56,196 in 2015, the most recent year for which data are available. That was virtually the same as in 2011, when that figure was $56,266 in inflation-adjusted 2015 dollars.

But over the same period, rental prices in the area shot up increasingly quickly. Rental website Zillow, which compiles nationwide home and rental data, found that the median monthly rent increased by 14.5 percent from the end of 2011 to the end of 2015.

That increase didn’t happen steadily. Instead, rents increased significantly in a short period of time. After remaining stable for a few years, the median rent in L.A. County increased rapidly in 2014 and 2015, with a peak year-over-year increase of 8.2 percent from June 2014 to June 2015.

Zillow’s rental index is calculated to reflect changes in the monthly median rent and account for fluctuations in the kinds of homes that are available to rent. This makes it suitable for comparisons, but individual data points are not a reliable indicator of median rent at the time.

It’s not obvious what led to soaring rents, but the trend has not slowed down. Zillow found that in July 2017, the median rent was more than 4 percent higher than a year earlier.

Official income data isn’t available after 2015, which makes it impossible to identify whether rent increases continue to outpace changes in income. Both the state of California and the city of Los Angeles have increased the minimum wage since 2015, to $10 and $12, respectively. Those minimums are set to increase to $15 in the coming years.

California’s statewide minimum wage had increased during the survey period before 2015, but those changes didn’t seem to affect the real dollars Angelenos could afford to spend after accounting for inflation. For example, the state minimum wage reached $9 per hour in July 2014, but the real median household income in L.A. County remained essentially unchanged.

The increase in rental costs might have had major impacts on individual lives. According to municipal government data, the number of homeless people in the Los Angeles area increased by 12 percent from 2013 to 2015, as rent prices increased dramatically.

That city and county data, compiled by the Los Angeles Homeless Services Authority, showed an increase in the total homeless count from 35,524 to 44,359 across the survey area, which did not include the cities of Long Beach or Glendale.

Though census income data isn’t available after 2015, continuing increases in rents and the numbers of homeless people suggest that this trend increased. The municipal governments’ 2017 homeless survey found that 55,188 people lived without homes in the L.A. area, an increase of 24.4 percent from 2015 and 55 percent from 2013.

Median rent has also continued to increase by sizable margins — it’s now 8 percent higher than in 2015 and 24 percent higher than in 2011, when the survey period began.

The Buttered Popcorn Index – A Deliciously Twisted Look At Economic History

movie_theaters_68947In an age where streaming movies on Netflix or Hulu has become the norm, many people assume the movie theater industry is a dying relic of a more financially stable time.

Every year, Hollywood releases reports blaming mediocre films for turning audiences away. Other people in the media think the industry is failing because younger generations are less interested in the big screen experience. Unfortunately, most of these reasons lack any statistical support.

The movie theater industry follows a rollercoaster-like business cycle that reaches its peak during different periods of time much like many sections of the U.S. economy. However, the unique characteristic of the movie theater business is that it thrives when most businesses are struggling to survive.

This is the Buttered Popcorn Index.

Throughout the history of U.S. cinema, there has been a trend in movie theater attendance as it correlates with the economic climate in the country.

During the Great Depression, the film industry had to cut costs in production and theaters had to lower ticket prices. This led to an enormous surge in the film industry with roughly 60 to 80 million people heading to the movies each week.

In 1982, movie theater attendance climbed 10 percent while the unemployment rate increased at a similar pace. However, as the economy healed, attendance dropped about 12 percent.

Screen Shot 2015-09-01 at 8.56.58 PM

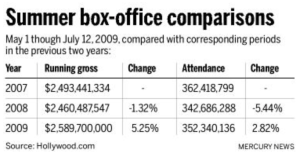
Now let’s look at our most recent recession. In 2008, the movie theaters earned roughly thirty million dollars less than in 2007. In 2009, the summer box office had an enormous spike in ticket sales after declining in 2008. The chart above shows how, between 2008 and 2009, theaters earned over one hundred million dollars more than 2008.

Screen Shot 2015-09-01 at 8.57.19 PM


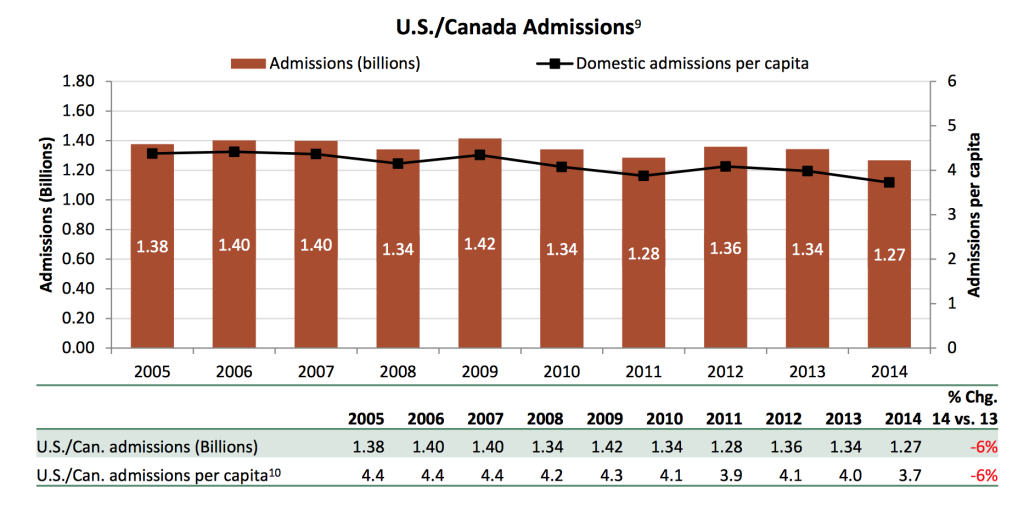
Movie theaters have not been able to maintain the 1.42 billion people they brought in during the rescission. The Hollywood Reporter released statistics in 2014 stating the number of people going to the movies had dropped six percent from 2013, which was the lowest in twenty years.

Ticket prices have played a large role in how people perceive the movie theater experience. Between 2001 and 2015, The price for move tickets increased from $5.66 to $8.12. The prices have blown up dramatically within the last fifteen years, yet there were more people going to the theater in 2009.

One of the main reasons why movie theaters had a surge during the recession was because even with the rise in prices, tickets have remained below ten dollars. Therefore, when times are tough for people, less of them look at going to the movies as an expense and more as one of the few remaining affordable options for entertainment.

“Generally, when economic downturns hit, we have seen an increase in box office and attendance in six of the eight last recessions,” said spokesman for the National Association of Theater Owners Patrick Corcoran in an interview in 2011,  “People seek relief in forgetting their problems, so they go to the movies, and it is the least expensive form of entertainment.”

Another reason for the success of the movie theater business in 2009 was the types of movies being released. Happier films like Pixar’s Up and the comedy film The Hangover raked in close to $300 million each during the summer months. This suggests many people were looking for an inexpensive way to enjoy themselves in a tough economic climate.

The Buttered Popcorn Index demonstrates that no matter what era it is, people tend to flock to movies to escape the realities of their financial situation.

Chonieconomics: The Men’s Underwear Index

Throughout the course of history, people have been caught with their pants down (so to speak) on various occasions by shifts in the economy—some sudden; some cyclical. Little did the gentlemen among these folks know that underneath said pants, was one of the more obscure metrics tracked as an indicator of the relative health of the economy.

The Men’s Underwear Index is, apparently, a real thing. So said Alan Greenspan in the 70’s.

underwear index_9 3

The orangutan, the zebra and the stork clearly lived in economic prosperity.

As we’ve discussed in class, economics often gets a bad rap because many people’s exposure to it consists of a bunch of old, white guys on TV talking about the most widely used economic indicator—the stock market—in what sounds like an alien language. However, despite it including the synthesis of a lot of real-time information, the stock market is a leading indicator (a measure of what people think is going to happen) and is, by nature, speculative. To some extent, the talking heads on TV are guessing, and they know it.

Chonies as an indicator, on the other hand, are referred to as lagging. (I know…sorry, gents.) A lagging indicator is simply a compilation of data points from what has already happened—in this case, purchases of men’s underwear. This empirical measurement has been a fairly solid indicator of what has happened with the economy since it came into existence almost half a century ago.

Per Esquire (repurposed from Business Insider), men purchase an average of 3.4 pairs of underwear per year. That number has tended to increase in times of economic prosperity and decrease in difficult economic times.

What I don’t understand is why this is considered some genius insight. It makes sense that in a down economy people would not spend money, primarily because they don’t have it.

The best explanation I’ve been able to find is that underwear is deemed a necessity, which sets it apart from other clothing items and makes it a better baseline. That hasn’t stopped economists from developing other obscure indicators as well. Hemlines, dry cleaning, ties and lipstick have all been referenced to measure the health of the economy, but the common thread through all of them is that people purchase more when the economy is good and they have the money to do so. Regardless of what CNBC analysts tell you, it’s as simple as that.

Greenspan trolled us all, but I suppose I should thank him. He gave me a reason to write about underwear in a class blog.

The Garbage Index: What A Load Of Rubbish Can Tell Us About The Economy

Our trash can tell us a lot about ourselves: What magazines we read, how much we love Trader Joe’s frozen pizza, or whether we’ve finally decided to get rid of your parents’ couch from the ‘70s. But, as it turns out, the sum total of our trash, and our neighbors trash, can also tell us a lot about the health of a country’s economy.

This is called the Garbage Index, which looks at the total amount of waste a country produces to measure the health and growth of its GDP.

1508921362

[Read more…]