The Plastic Surgery Indicator – More Money, More Procedures

Plastic surgery (otherwise known as cosmetic surgery) for elective reasons is an industry that profits from the will of the people to improve their appearance by going under the knife. This type of surgery is not commonly covered by healthcare – which leaves the patient having to pay the pricey penny for a new appearance. Having disposable income to cover the costs of the surgery, and the ability to take off time from work to recover, are two important factors for this procedure – and the industry took a negative hit when the height of the recession was felt, leading to a downfall in 2009.

Screen Shot 2014-09-03 at 11.31.51 AM


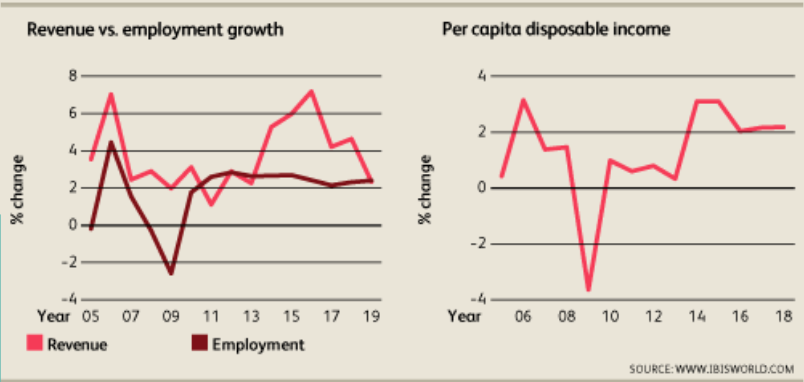
As the figure shows, the revenue of the plastic surgery industry was negatively affected from the recession, as less disposable income was available in the economy. This type of negative change proves to be an economic indicator as this type of surgery relies on the willingness and availability for the population to pay for pricey appearance improvements. As the “dominoes” game analogy would describe it, once the revenue of the plastic surgery fell down, this immediately led to the downfall of employment for plastic surgeons. Once the recession showed signs of improvement and more disposable income was available, there was a positive percent change in revenue and employment. The growth in the plastic surgery field indicated as a beneficial sign for the economy – more money to spend in plastic surgery also meant that the population was feeling confident enough to spend more money on their appearance.


As the figure shows, the growth of plastic surgery was 2.3% from 2008 to 2013; however, this number is expected to further incline as  annual growth from 2013-2018 is predicted to be 5.5%.

To understand the entire picture, it is important to consider other changes in the economy that help fuel this increase in growth. First of all, the aging population (specifically the Baby Boomers) will account for a larger portion of the population. With a large section of the population in this age group, services that the older population will desire may create a shift in demands for different industries. The plastic surgery industry will feel this change in a positive manner as aging commonly has a negative connotation in society – but paying for a quick procedure to look a little more youthful will become more of the norm.

Another factor for the positive growth is the increase in technology for less evasive plastic surgery procedures. The money that is available for this type of research is on a different pedestal versus life-saving medical technology – it doesn’t have as much priority. With this in mind, there are still vast efforts for this exploration, which indicates that there are more resources available in the economy for cosmetic purposes as well.

Plastic surgery is a growing field, and signifies the willingness and ability for consumers to pay out-of-pocket costs for appearances. As this industry has grown, so has the public perception of undergoing such surgeries to become more of a common occurrence.  Although superficial, this industry is a solid indicator of disposable income that is available for the population to spend.

Source: http://clients1.ibisworld.com/reports/us/industry/ataglance.aspx?entid=4157
 

A Higher Heel to Combat the Economy Downturn? – the High Heels Economic Indicator

HighHeel As the world-class luxury shoes designer Jimmy Choo said: “the right shoe can make everything different”.  It seems the high heels now are not just women’s “last touch of elegance” (quoted of legend designer Coco Chanel), but also the weapons women are using to fight against the economy recessions.

IBM conducted a computer-based analysis project on billions of social media posts about about shoe trends, heels are about to go down. The report came out at 2011. In the report, the researchers claimed that the higher the heels, the worse off the Economy would be.

“Usually, in an economic downturn, heels go up and stay up – as consumers turn to more flamboyant fashions as a means of fantasy and escape,” said Dr. Trevor Davis, a consumer products expert with IBM Global Business Services. “This time, something different is happening — perhaps a mood of long term austerity is evolving among consumers sparking a desire to reduce ostentation in everyday settings.”

According to an article published by the Christian Science Monitor from CNBC wire, the several big recessions of the U.S. Economy in history have shown the correlation between the economy status and the height of the heels.

In the 1920s, women were wearing high-heel pumps and platforms to get their confidence back during the Great Depression. In the 1970s oil crisis, platforms came back en vogue as the low-heeled sandals of the late 1960s were cast aside. In the 1990s, the low, thick heels of the “grunge” period were replaced by “Sex and the City”-inspired stilettos just as the dot-com bubble burst.

1920-1970-1990

From left to right: wall deco in 1920s; the popular platform shoes in 1970s; vintage stilettos from 1990s. 

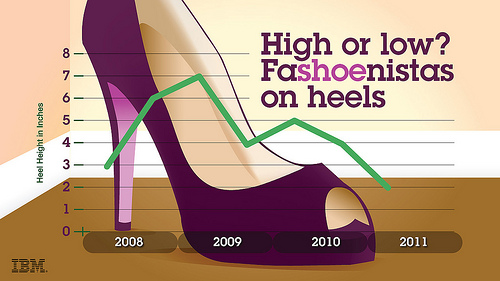
From the report published in 2011, an analysis of the four years (from 2008 to 2011) of social media showed that discussions of increasing heel height peaked towards the end of 2009, and declined after that. For example, key trend-watching bloggers between 2008 and 2009 wrote consistently about heels from five to eight inches, but by mid 2011 they were writing about the return of the “the perfect flat”. The sky-high heels were not gone yet; rather that, as the economy has bounced back a little, the bloggers were discussing as glamwear and not for the office or shopping trip.

6351154517_74baa80950

Source: IBM

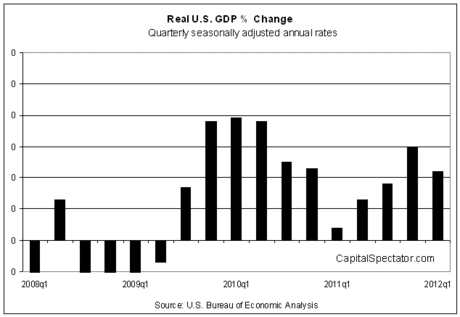
As the statistic from the U.S. Bureau of Economic Analysis indicated , from the year of 2009 the U.S. economy slowly stepped into a recovery session. The GDP grew at an annual 2.2% rate in the first three months of 2012, considerably slower than the 3.0% increase in 2011’s fourth quarter.

USGDPchange2008-2012

From the comparison and analysis for these two groups of statistics, there seems to be a kind of correlation between the economy growth and the change of women’s heel heights. Nevertheless, according to the Huffington Post, there could be other possible reasons for the dropping of heel heights.”Women may simply be ditching their heels in favor of a more pain-free walking experience, or, for once, low heels may actually indicate longer-term economic woes,” quoted from the Huffington Post’s article.

The Times Magazine responded to the newly-born High Heel Economic Index with a multimedia project: The Hazards (and Power) of Higher Heels, where the magazine tried to analyze the societal and economy reasons behind the changes of high heels.

Fashion trends have become popular economy indicators these days. Dated back to 1926, economist George Taylor came up with the Hemline Theory, which himself explained as when women wore shorter skirts to show off their expensive silk stockings during good economic times, but longer hemlines were more preferable to cover bare legs during a recession. In the 2000s, Leonard Lauder, the chairman of Estee Lauder companies, introduced the idea after noticing that lipstick sales jumped in the aftermath of 2001 terrorist attacks, according to The New York Times. He developed the scenario as the Lipstick Index, which indicated that women turn to less expensive indulgences, like lipstick, when they felt less confident about the future.

When talking about economy, people relate to numbers, analysis reports and charts. Nevertheless, something that seems not related  to economy actually has its significance for the economy prediction. And wen it comes to shoes, perhaps they will be able to tell a lot.

The Big Mac Index


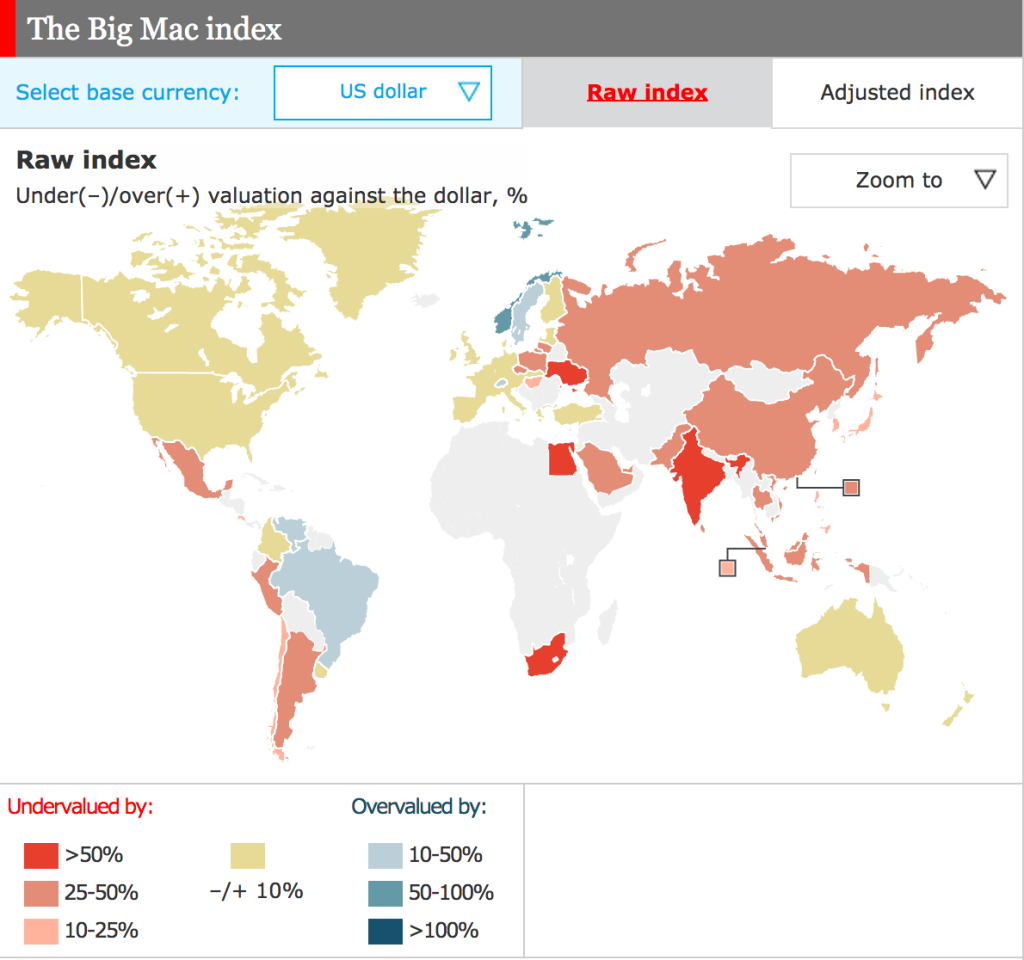
The Big Mac Index (BMI)012814_0348_2, was introduced by The Economist  in 1986 to “make exchange-rate theory more digestible” — tracking the over- and under-valuation of each currency against the dollar. The Big Mac Index was based on Purchasing Power Parity (PPP) Theory that a particular amount of dollars should be able to buy an identical basket of goods in each country. And that basket of goods here is the Big Mac.

If a country’s dollar price of a big mac is less than that of the United States, it means that the country’s currency is undervalued against the dollar. For example, in July 2014, $4.80 buys a Big Mac in the United States, while $2.73 buys one in China. Therefore, the yuan is undervalued by 43.13% ((2.73-4.80)/4.80*100%=-43.13%) .

McDonalds’ Big Mac is produced nearly in the same manner and held to the same standard in more than 100 countries, thus the index makes comparing many countries’ currencies possible.

Screen Shot 2014-09-02 at 12.50.26 AM

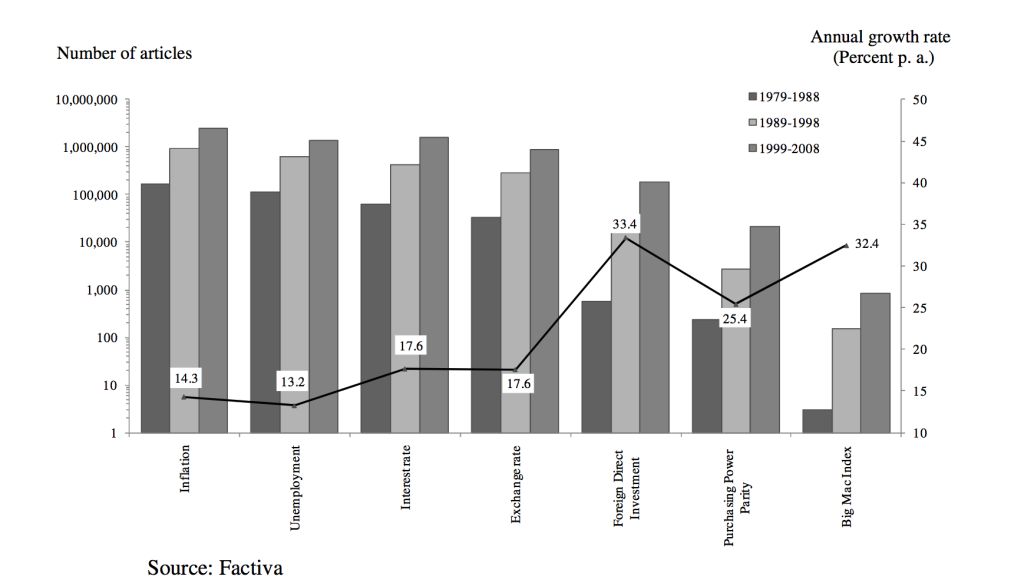
The BMI has been a heated topic with one of the highest annual growth rates among other popular economic indicators since it was introduced.

Screen Shot 2014-09-02 at 12.57.31 AM

Source: The Economist

In the map above,  Asia is the cheapest place to buy a big mac — Asian countries’ currencies are undervalued while European countries’ are overvalued. In 2014, the most undervalued currency is Hryvnia, undervalued by 66.09% against US dollar, and the most overvalued currency is Kroner, overvalued by 61.79%.

Screen Shot 2014-09-02 at 2.51.26 AM

Source: The Economist

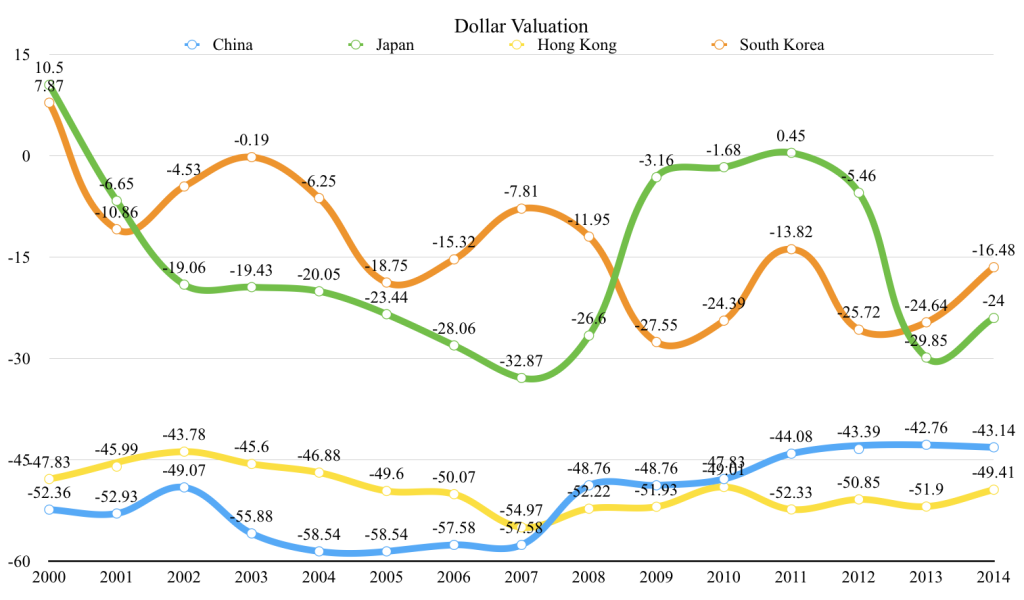
The table above indicates the trends for the four East Asian currencies tracked consistently from 2000 to 2014. South Korea is still in as big an upheaval as it was ten years ago. It began with a valuation 7.87% above the dollar and ended up with a valuation 16.48% below the dollar with some ups and downs in between. The yen has had a bumpy ride too.

The Big Mac Index for South Korea

The Big Mac Index for South Korea

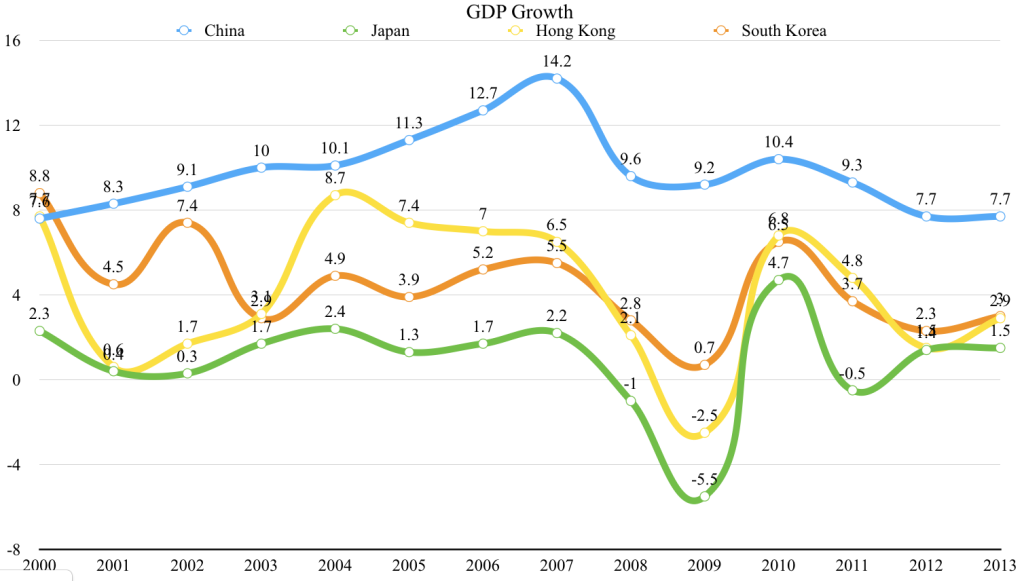
After being pegged to the dollar for more than three decades, the won became a floating currency in 1997. Also in 1997, South Korea was confronted with Asian Financial Crisis and the region’s currency depreciation (other three biggest victims are Thailand, Malaysia, and Indonesia). 1997 is one of the watersheds — the won’s BMI curve had been comparatively gentle by the end of 1997 but it dramatically plunged from 1996’s 25% to 1998’s -31%. After the IMF bailing out the country in 1998, South Korea ushered in a moderate economic growth. 2008 is another watershed. Influenced by the global economic crisis, the won ‘s BMI experienced a downtrend from -7.81% to -27.55%. More evidently, the won’s BMI curve goes hand in hand with South Korea’s GDP growth, sharing a precisely synchronized rise and fall.

Hong Kong dollar and Chinese Yuan have remained relatively steady over the last 14 years. Hong Kong’s relatively smooth curve (47.83% undervalued in 2000 to 43.14% undervalued in 2014) can be explained as “Hong Kong dollar is tied to the American dollar”.

Screen Shot 2014-09-02 at 2.51.39 AM

Source: The Economist

How about China? Its relative stability (52.36% undervalued in 2000 to 43.14% undervalued in 2014 with little movement in between) might be partly attributed to the steady economic growth even during the crisis. 

RMB

Source: The Economist

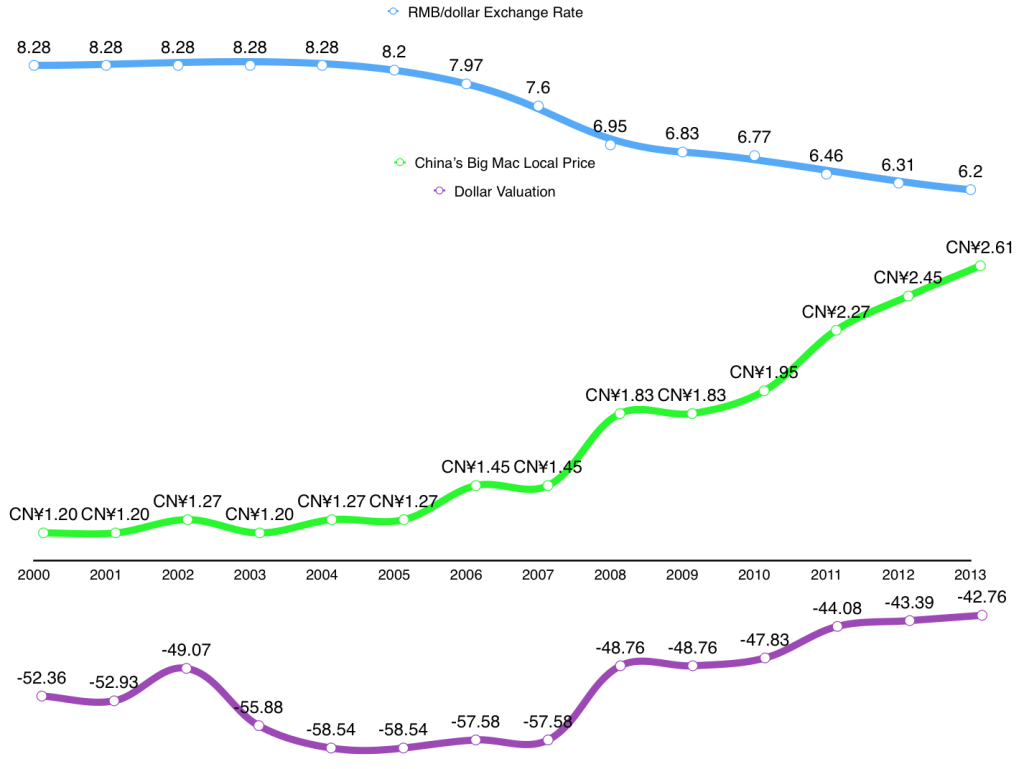
The Big Mac Index also reveals the rise and fall of the currency’s value under the mask of a Big Mac’s unvaried local price and exchange rate. Taking Chinese Yuan as an example, the exchange rate and the average local price of one Big Mac almost remained unchanged from 2000 to 2004, but the BMI implies that the yuan was undervalued to a varying degree during that period. The relation between BMI and RMB/dollar exchange rate has become more reasonable since 2005, because RMB/dollar exchange rate was tuned to be more “natural” by the Chinese government in 2005. This can be further explained by China’s changing currency policy.

In 1994, the Chinese government announced an initial RMB/dollar exchange rate of 8.70, which was raised to 8.28 by 1997 and remained constant until 2005. In 2005, the Chinese government modified the RMB’s exchange rate to become “adjustable,” adjusted from 8.28 to 8.11. China then halted its currency appreciation policy from 2008 to 2010 in response to the global economic slowdown, RMB being pegged to the U.S. dollar for roughly two years. In June 2010, Chinese authorities allowed the exchange rate to appreciate answering to market forces’ call.

Like any other economic indicator, the BMI has limitations. First of all, due to the different social status of fast food in different countries, the selected item may not be representative enough to see the whole picture of the country’s economy. Second, Big Macs are produced in various sizes with different ingredieants, and McDonald’s even use different commercial strategies around the world, which would result in a “non-identical basket” of goods.

With the popularity of the BMI, some similar indexes came into being. The alternative indicators based upon PPP Theory are iPad Index and iPod Index.

Japan shows 96.34% correlation between alcohol consumption and household income

Alcohol has never been seen as essential as the bread and milk for people’s life. But for a long time, alcohol consumption has played an important part in some country’s economy, and in some ways, helped indicate the economic growth, employment issue, and even social problems.

alcohol-pic

Alcohol has never been seen as essential as the bread and milk for people’s life. But for a long time, alcohol consumption has played an important part in some country’s economy, and in some ways, helped indicate the economic growth, employment issue, and even social problems.

Anton Reed, from Washington and Lee University, used Figure-1 demonstrating a strong correlation (79.5%) between household alcohol consumption and GDP. When GDP decreased and fluctuated afterward, in response, alcohol expenditure also decreases.

1st graph:  %change in Income and %change in Alcohol Expenditures 2nd graph: Japan's Alcohol Expenditure and Average Annual Household Income

Figure-1
1st graph: %change in Income and %change in Alcohol Expenditures
2nd graph: Japan’s Alcohol Expenditure and Average Annual Household Income

And the statistic implies more, when it touches on the drinkers, the consumers. Figure-2 reveals a correspondent increase/decrease between alcohol consumption and income. And the statistical correlation is as high as 96.34%.

1st graph: %change in Income and %change in Alcohol Expenditures 2nd graph: Japan's Alcohol expenditure and Average Annual Household Income

Figure-2
1st graph: %change in Income and %change in Alcohol Expenditures
2nd graph: Japan’s Alcohol expenditure and Average Annual Household Income

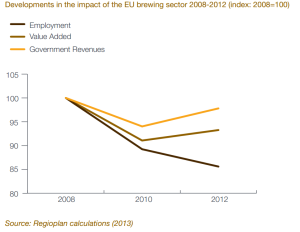
Similar results showed up in the study commissioned by the European Brewing Sector regarding beer consumption in European countries. An article named It’s a Beer Recession by Jack Ewing illustrated how unemployment rate and the European debt crisis influenced people’s drinking habit. Figure-3 shows that the EU brewing sector suffered from a severe economic downturn from 2008 to 2010, when Europe’s economy fell down under the strike from the U.S. Great Recession. People became pessimistic of European economy, and both government revenues as well as employment in brewing sector fell dramatically.

Developments in the Impact of the EU brewing sector 2008-2012

Figure-3 Developments in the Impact of the EU brewing sector 2008-2012

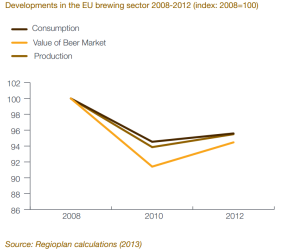
Along with that, in Figure-4, beer consumption decreased by nearly 9%, and the value of beer market and production also responded in the same way.

Developments in the EU brewing sector 2008-2012

Figure-4 Developments in the EU brewing sector 2008-2012

Ewing pointed out that “…the employment in the beer industry fell by 12 percent, or 260,000 jobs, the study said…Job losses can exacerbate the debt crisis because unemployed people typically collect benefits rather than pay taxes. When beer consumption declines, governments also collect less sales tax on beer sales.”

On top of Japan and European countries, China, considering its successful and tremendous alcohol market, also showed a trace of the relationship between alcohol consumption and economic growth. According to Consumer Trends: Wine, Beer and Spirits in China released by Manitoba government, off-trade* sales make up 80% of spirit sales in China, and the total expenditure increased by 7%. At the same time, the volume of on-trade spirits decreased from 2008 to 2009, because of reduced expenditure on entertainment during hard economic times.

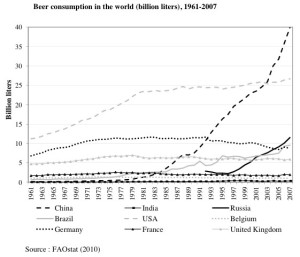
Beer consumption in the world (billion liters), 1961-2007

Figure-5 Beer consumption in the world (billion liters), 1961-2007

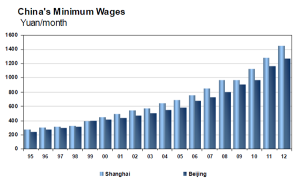
Also, Felix Salmon from Reuters showed Figure-5 demonstrating a boost of beer consumption in China, as the broken line tilts up after 1977. Comparing beer consumption after 1995 with Figure-6, the statistic reveals a corespondent increase in both values. Salmon explained that, “what we’re seeing here is largely the China effect — and, more generally, a world where poor people, once they reach a certain minimum income, start hitting the hops.”

China's Minimum Wages in Shanghai and Beijing

Figure-6 China’s Minimum Wages in Shanghai and Beijing

Thus, from the above cases, we may see that once the country is in recession, the unemployment rate goes up, then people’s drinking money shrinks, then the alcohol consumption decreases. So if people want to know how a country’s economy looks like, they may take a look at its alcohol market, unless it doesn’t have a strong culture of drinking.

For an endnote, what’s interesting but opposite to the alcohol index is that, in the U.S., alcohol consumption goes up even when the economy goes down. Michael French from University of Miami found that binge drinking increased with a rise in the state-level unemployment rate. Driving while intoxicated and alcohol abuse and dependence also increased for both genders and across ethnic groups. This has been said that alcohol index is not enough for us to peep into one country’s economy.


*On-trade = alcoholic beverages sold in restaurants, bars etc.
 Off-trade = alcoholic beverages sold in retail stores

Lipstick Index – A New Economic Indicator Under Recessions

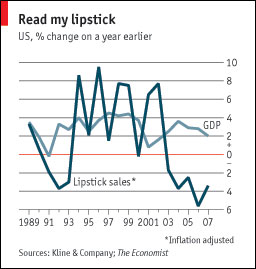
During the early 2000s recession, the chairman of the board of Estée Lauder, Leonard Lauder, was surprised to notice that the sales of lipsticks under its several brands increased rapidly compared with other cosmetic products produced by the corporation. Considering the financial difficulties people encountered at that time, Lauder believed that small items like lipsticks could serve as substitutes for luxury goods that people could no longer afford. This phenomenon was then named the “Lipstick Index,” and economists began to consider it a new economic indicator.

Applying red lipstick

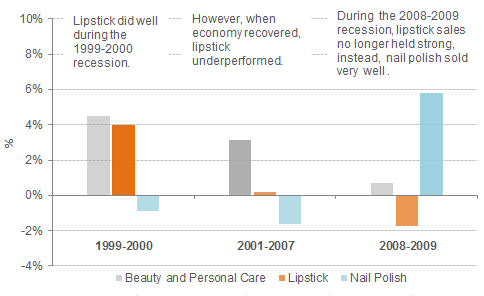
However, in the most recent recession, lipstick sales seemed to contradict the golden rule of the “Lipstick Index.” According to the report released by market research firm Mintel, lipstick purchases continued to fall since the year 2007. People started to doubt whether the “Lipstick Index” was valid. Was the increase in sales in early 2000s a coincidence? The answer is “No.”

CWB739

In fact, one of the most famous cosmetic groups, L’Oréal,  saw its sales grow 5.3 percent in 2008, the heart of the most recent recession. This number indicates that beauty market was still active during the economic downturn. What’s interesting is that, as the sales of lipsticks underwent a certain decline, sales of nail decoration goodies like nail polish are up 65% since the first half of 2008, according to market research firm NPD Group. The unpredictable shift had to do with the glut of lipsticks on women’s dressers and their increasing demand for nail beauty. As a result, the “Nail Polish Index” has now become a new indicator of the economy.

alipstick4th

How do products like lipsticks and nail polish measure the economy? There are several rationales behind it. First, when people could no longer afford things they used to consume, they simply turned to inferior goods. For example, it might be hard for them to consume big-ticket items like houses, jewelry or autos, but as for inexpensive goods like lipsticks, they could absolutely afford it and enjoy the fun of shopping. After all, even lipsticks of top brands are under $40 nowadays. Second, according to a research conducted by the Texas Christian University, women are more likely to buy beauty products during recessions. This is because women feel more secure with makeup and nicer clothes while their bank account balances are under pressure. They try to compensate themselves with small and affordable indulgence, like lipsticks, perfumes, nail polish and others.

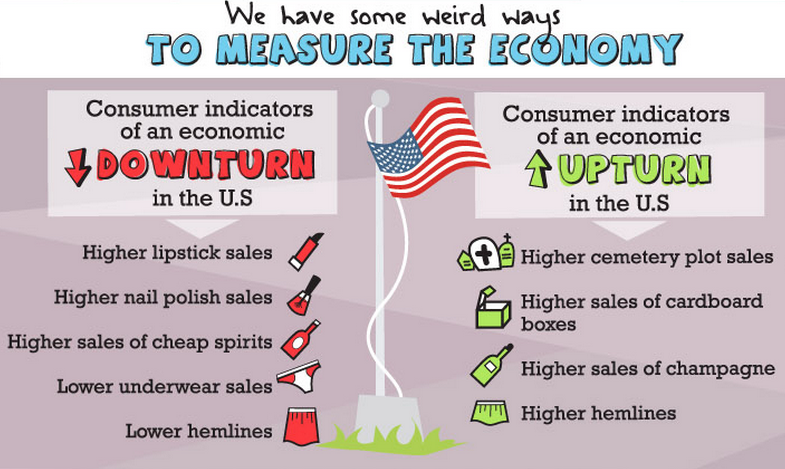
Since the emerging of these unusual indicators, more and more categories were defined as the indicator of future economy. The info graphic showed below lists some weird ways of gauging the economy, including sales of cheap spirits, underwear sales and lower hemlines. Although they are not as authentic as widely recognized indicators like GDP or unemployment rate, they actually provide us with a different view of the economy.

Screen-Shot-2014-04-22-at-12.39.37-PM

Leisure Time

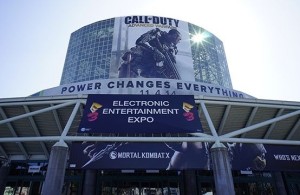
A good measure of how the economy is doing, or an economic indicator, is what people do in their free time. For this blog post I chose the topic of video games, specifically E3. E3 is one of the biggest video game conferences in the United States where huge companies like Microsoft, Nintendo and Sony make announcements about their new gaming systems.  In today’s economy, video games make money at a much quicker rate movies do. “Grant Theft Auto V, by Rockstar Games  make $800 million in its first 24 hours,” quoted by Anya Kamenetz, a blog post writer from Fast Company. Many people assume Hollywood is the biggest entertainment industry in terms of making money for California. However, video games are the silent winner that many people overlook.

In 2012, Activision, the major video game company that created Call of Duty: Black Ops 2, revealed that it had hit $1 billion dollars in sales in just 15 days. The top grossing movie of all time, “Avatar, took two days longer to earn the same amount” (Kamenetz).

Screen Shot 2014-09-07 at 12.08.08 PM

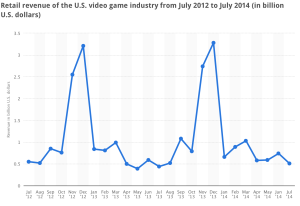
This graph shows the sales of video games from 2012 compared to the 2013. Looking closely one can see that at their peaks in December, sales from 2012 to 2013 have grown from $3.21 billion to $3.28 billion. Holiday season is the time when children know they can ask for the biggest present from the parents, so naturally the sales of video games in December greatly exceed the sale of video games any other time. If you look again at the graph, the points in the year of 2013 are slightly higher than the points from 2012, a clear economic indicator that the U.S. economy is steadily growing.

A convention that happens every year in the heart of Los Angeles is E3, home to one of the biggest video game, tech, and gadget shows. Polygon, one of the leading American websites online that informs its viewers about video game’s news, culture, and reviews, reported that some 48,000 people attended E3 this year, that’s 1.5% more people within the Los Angeles Conference Center than there was last year, a clear economic indicator that Los Angeles is not doing too bad for itself. Measuring an increase in video game purchases from year to year could be a good economic indicator; however having individuals wait hours in line just to go to a convention to hear when exactly the video games will come out e should reveal that the economy is doing well enough for individuals to sacrifice work time to attend this event.

E3

More simply, people not only have the free time to play video games, but they also have the free time to spend money on tickets to the event. If the economy was not doing so well, individuals  Video gaming is one of the biggest chunks of entertainment-related sales, so naturally using it as an economic indicate whether our economy is progressing or regressing.


Nick Wu


Enter the Chinese Philanthropy

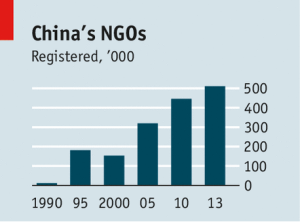
NGOMore than 500,000 NGOs have registered over the past 25 years, a figure that some think will double over the next couple of years, as rules are relaxed. Many of these, admittedly, are quasi-state bodies, like an official youth foundation, or businesses in disguise, like private schools, but a growing number are the real deal. And a further 1.5m-odd NGOs operate without being registered, including some that the party suspects of being too independent or confrontational, according to Economist.

The essay from Economist reminds me of my recent experience about charity and NGO in China. I have never connected with any NGO in China before. However, in the past four months, I participated in an everyday philanthropy campaign for helping collect free lunch for poor kids in China villages from the beginning till now, launching online this Saturday (May 10th). We corporate with a Chinese NGO named “Free Lunch”, which especially helps with collecting money from companies and buying food for the kids who couldn’t eat hot meal for lunch. Our campaign is trying to ask young people overseas contribute simple actions (social media likes/shares, taking a photo/video) in exchange for free lunch (donated by companies) for starving kids in China. We named it “One Way“.

https://www.youtube.com/watch?v=FMm2GQVsGmw

It’s not easy to communicate with a NGO group in China well, actually it became one of our biggest troubles. More people enter into NGO and help with charity should be a good thing. However, we haven’t set up a standard or rules for everyone to operate the group smoothly.

” Working with a Chinese NGO requires being flexible and adapting to sudden personnel or regulatory changes,” according to China Development Brief The report shows that we still not in a stable situation or circumstance for the development of NGO in China. I hope we could have more regulations in the near future and make it easier for young people who want to contribute to Chinese charity.


ChiNext Pioneers-Young Chinese Entrepreneurs

ChiNext is an important component of China’s multi-tier capital market system, which offers a new capital platform tailor-made for the needs of enterprises engaged in independent innovation and other growing venture enterprises. ChiNext Pioneers represent those entrepreneurs who are trying to start or operate their own businesses in US.

https://www.youtube.com/watch?v=pT7QeFovSnE

Tianyi Zhong is one of those pioneers who are trying to start their own businesses. After getting his master degree in Information Technology and Services from USC, he and his girlfriend, Yi He opened a Chinese fast food delivery company, Chopopfoods.

“I always want to start my own business…I don’t like the food around our campus…so I think if I have chance to cook I would make it more delicious and healthy…Then I talked to my girlfriend and she supported my idea…Actually USC has a lot of Chinese students,” said Zhong.

After deep conversations with their parents, they decided to start their new business with the money, 50,000 dollars, supported by their parents.

As the largest segment of enrolled international population, USC has 2,515 Chinese students, which ranks NO.1 in US universities, according to annual Open Doors report by the Institute of International Education.

In September, after eight-month preparations, Zhong finally signed a contract with a professional catering kitchen in downtown area, Los Angeles and officially started his business in October.

They set up a website and an app, which both could search their menus and order meals online. After the first month, they built connections with some returned customers and their friends. On Chinese twitter, Weibo, they launched special order promotions for attracting customers and got much more followers than before. However, the booming market didn’t bring them more orders.

“…Eight to nine dollars for a combo is actually cheap for lunch…we plan to have 30-50 orders every day after the first month, but it’s much harder than we imagined…the truth is that we only have less than 15 orders every day…under our expectations,” said Zhong.

In December, China News, one of the largest Chinese news agencies, reported their story on Chinese websites. They were getting popular on Chinese Internet and even attracted Chinese investors who are in US.

“ The investor told me that he could invest around one million dollars…we met once in bay area before…it’s just unbelievable…We are going to meet again after New Year,” said Zhong.

In Las Vegas, Zhong and his girlfriend met their investor Mr. Xi. After two-day negotiations, 10,000 dollars would be put at the beginning stage for new products research such as fresh fruit juice and marketing plans, which means they have to change their original business model.

“ With the money we can hire more people to help us with market research and other stuff…but it’s getting a little bit different with our original goal… we are still thinking over the whole business plan,” said Zhong.

More than 200 million businesses are started in US every year, according to a study released today by the Small Business Administration Office of Advocacy, nearly 20 percent of immigrant-owned businesses started $50,000 or more in startup capital, compared to 15.9 percent for non-immigrant-owned business.

Zhong has entirely stopped his food delivery since February. They might need more time to adjust their dream and try to find a way to achieve it in the real world. They still have a long way to go.


Is China ready for Tesla?

In April, the initial delivery of Tesla arrived in China. As one of the first customers, Dongfeng Wang got the key from Elon Musk who is the founder of Tesla Automotive in Beijing. Wang described that driving Tesla reminds him of the experience using a new smartphone, according to Phenix.com.

“I fall in love with it at first sight, I paid 40,000 dollars for ordering a Tesla while I visited Tesla in Silicon Valley,” said Wang.

Building up the marketing team in China at the beginning of 2013, Tesla already received 5,000 orders all over China by the end of the year, even though they hadn’t set up any service store in Beijing yet. It became a new luxury fashion among Chinese rich people. The average price of a Tesla Model S costs about 800,000 RMB (around 150,000 dollars).

Tesla–the apple of auto industry 

Founded in 2003, Tesla, as an electronic car company, has been making records in the past few years not only for their plan to build the world’s largest lithium-ion battery factory, but also for the new Arizona bill that would allow the company to sell cars and bypass dealers, a win in its ongoing battle in other states against dealer licensing regulations, according to Forbes, the interview with Eugene Groysman, an Apple expert at Marketocracy.

“Just like Apple, Tesla has an opportunity to revolutionize a market. With Apple it was the unique products of the iPod and iPhone that revolutionized the digital music and mobile phone markets,” said Groysman.

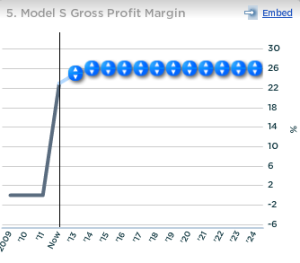
Elon Musk, as the founder of Tesla and Space X, created a new revolution in auto industry. Electronic car technology was not latest developed but Musk made it as a new fashion of driving. In Tesla’s 10 years of existence, the company has suffered through embarrassing delays and leadership overhauls, verged on bankruptcy at least once, and been a favorite target of short sellers. In May 2013, it posted its first profitable quarter, with earnings of $11.2 million; sales for the first quarter rose 83 percent, to $562 million. Now more and more young people love to choose a Tesla or make it as one of their dreams to achieve.

profit margin

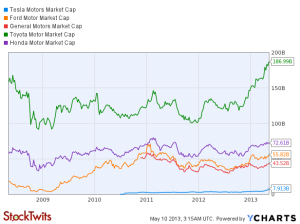
Following Tesla’s lead, General Motor and Ford have started hiring software developers in its technology department. “The carmakers see kids opting to watch movies on their iPads instead of on pricey, built-in infotainment systems, and know they need to find a way to keep up”, by Bloomberg BusinessWeek. Tesla has just released its Q1 financial results. Adjusted earnings per share came in at $0.12 per share, which was higher than the $0.07 expected by analysts surveyed. During the quarter, the company produced 7,535 models S and delivered 6,457, according to Bloomberg. The stock is down by around 6% in after-hours trading. Management expects about 7,500 deliveries in Q2 and says it’s on track for 35,000 deliveries for the year.

“We are expanding our factory capacity to support increased Model S production later this year and the introduction of Model X next year,” said Musk.

Screen-Shot-2013-05-09-at-8.29.49-PM

Tesla’s Competitors

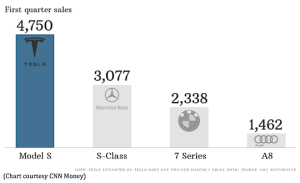
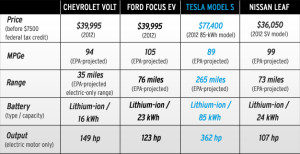
In the traditional auto industry, there are several old electronic car brands such as Chevrolet Volt, Ford Focus EV and Nissan Leaf. Tesla’s sedan may fall short of some of its electric competitors’ efficiency, but its driving range blows every one of them out of the water, according to an assessment website, Car and Driver. However, Tesla was outstanding on sales in the first quarter.

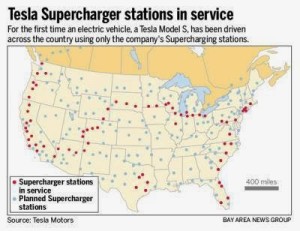
The company’s supercharger network is expanding quickly, it feels like a new location opens almost every other day. With 65 chargers in the U.S., 14 in Europe, and plans to expand it to China, Tesla is doing what it can to make it possible to drive its cars long distances given the constraints of current battery technology. The network is especially strong in California and along the west coast, where Teslas have been especially popular, according to Forbes.

Tesla-Earnings

Coda and Fisker were two main competitors in the new electronic vehicle industry. Parent company Coda Holdings filed for bankruptcy protection in 2013 in Delaware. Bloomberg Business Week says Los Angeles-based Coda Holdings is seeking to sell its assets to a publicly traded private equity group, Fortress Investment Group, for $25 million. It listed assets of up to $50 million and debt of $100 million. Fisker lost money on its first model. Unlike Tesla, though, Fisker ran out of cash before it could rein in costs and establish tighter controls. Fisker stopped production in the summer of 2012, and was seeking new investment. Fisker eventually declared bankruptcy in November 2013, and in February 2014 the company was bought by Chinese auto-parts conglomerate Wanxiang Group, according to Bloomberg BusinessWeek.

Tesla-Model-S-chart2

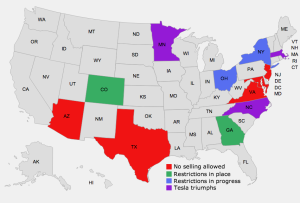
At the same time, Tesla was also struggling with government rules in US. It has to overcome strong political opposition in many states. It is one of significant hurdles about which there is much disagreement.

If there’s a secret to Tesla’s success, it’s been to outsource as little as possible. According to Bloomberg, the company has insisted on doing just about everything it can in-house, which has helped it develop intellectual property and control costs. Tesla built the battery pack replacement feature into the Model S, for example, and then designed the robots that will do the work. None of the engineers came from the auto industry; they were largely solar-powered car hobbyists and gadget makers. A key decision by the founding crew was to lash together thousands of the lithium ion batteries found in laptops to form a giant battery pack.

charger station

To the investor, the biggest concern is that the Model X and the new sedan won’t be cheap enough to attract regular buyers.

It won’t break down sales by state, though the company has opened multiple stores in New York, Texas, Illinois, and Florida, and says about three-quarters of revenue comes from outside California, according to Bloomberg, and its next test will be in Europe and Asia. Investors will be watching closely to see whether Germans and Chinese take to the car the way wealthy American geeks and eco-absolutists have—and if they do, how well that Fremont factory holds up under the stress. These are predictions for Tesla.

Tesla-Map

Tesla vs. BYD 

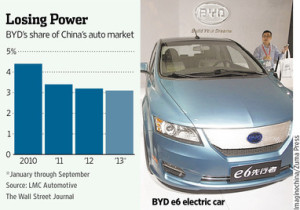
Founded in 1995, BYD has developed very quickly at the early ages in China. Recent years, it has been losing power in China’s auto market. However they put more effort on digging into US market. A battery-powered, 40-foot bus is set to roll off the assembly line in a former recreational vehicle factory in Lancaster, California, a blue-collar desert community north of Los Angeles. The $38 billion Chinese conglomerate makes everything from electric cars to LED lighting to solar panels, according to Los Angeles Times.

losing power in China market-BYD

Most of media focused on BYD’s rocky entry into the U.S. market and his famous investor-Warren Buffet. California state regulators last year docked the company $99,245 for violating state labor laws by under-paying Chinese engineers it brought over to work at the Lancaster factory. The labor commission later dropped that charge and reduced the fine to $37,803 for minor infractions of state labor laws. However, it didn’t stop BYD to become the “official electronic vehicle”.

http://youtu.be/sA3Sz1T79mc

“BYD could make a Tesla any minute if consumer demand for electric cars really ramps up.” that was the latest bold claim by Wang Chuanfu, chairman of BYD.

Wang also acknowledged Tesla got an astonishing success at developing high-end electric cars, changing consumer-buying habits, and training environmentally conscious drivers. However, Wang believes that Tesla’s high-end electric car strategy is not compatible with BYD’s low-end consumer strategy. not planning to go head-to-head competition with Tesla.

“For us, the technology for pure electric car is not the problem. The problem is the market. To scale up new production capabilities, it takes about 4-5 years,” said Wang.

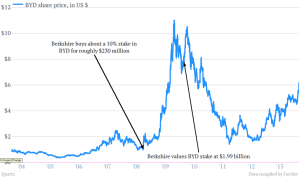
Holding 10% stake in the company back in 2008, Warren Buffet is BYD’s rock. At the moment, BYD’s all-electric e6 car—not a high-performance sports car like Tesla’s has been sold only in Shenzhen, where it is mainly used for taxicabs. It has struggled to gain traction due to a high sticker price, which costs about $60,000 in China, according to the Wall Street Journal.

byd

As a hugely important market for Tesla and BYD, China will be their direct battlefield in next decades. According to Quartz, Dougherty & Company analyst Andrea James has said it has the potential to be the company’s second biggest market. Tesla unveiled highly competitive pricing for the Chinese market earlier this year and plans to start selling cars in April. Whatever Musk may have said in 2011, BYD may now be the company he has to beat.

Is China ready for Tesla?

A group of 23 Chinese Tesla buyers from cities other than Beijing and Shanghai has filed a class action against the company addressed to Tesla Automobile Sales (Beijing), Chinese retailer of Tesla, and CFO of the company Deepak Ahuja. Tesla is accused of consumer fraud or false advertising for changing the shipment order of the preordered automobiles without noticing the customers, according to TechNode.

The customers complained that Tesla promised consumers to ship products based on the payment order of deposit, which amounts to 250,000 RMB ($40,150), but customers in Beijing and Shanghai received emails to take their preordered cars recently, while buyers in areas other than these two cities are left behind. Elon Musk, the CEO of Tesla visited China last month and amid customer complaint turmoil.

Musk had another “mission” for his tour in China, handing keys to first delivery customers. He ever described China as a “wild card” in the company’s future. It’s all about timing.

China has set a target of having 5 million electric vehicles on its roads by 2020 as part of efforts to curb pollution, and other automakers are closely watching to see if Tesla can win over consumers in the market, according to LA times.

Beijing recently held a special auction for electric-vehicle license plates. The government also offers special incentives to buyers of Chinese-made electric vehicles, for instance, the Beijing municipal government enforced a quota of about 13% for hybrid electric and full-electric vehicles in the license plate registration lottery. And this share will keep increasing through 2017 to about 40%. The incentive has not been appealing enough for many in China. At the latest draw, while each permit for conventional gasoline autos received more than 90 bids, only 1,428 people applied for the 1,666 NEV plates on offer, according to ckgsb.edu. However, Tesla does not qualify for the program.

Besides government incentives, subsidies and tax reduction benefits provided for electric vehicles are certainly attractive in China.

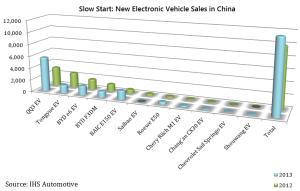
EV-Sales-in-China1

Based on the targets set out in March 2013, the overall number of NEVs must reach 0.5 million in 2015 and 2 million by 2020. This revised target is less than half of the target of 5 million set earlier for 2020. Also, according to IHS data, at the end of 2012 there were only 27,800 such vehicles on the road, of which 80% were electric buses. Last year China sold a total of 17,642 NEVs including the 11,963 passenger NEVs (refer to the graph). This brings the total number of NEVs in operation to 45,442 units.

Among the first nine buyers to receive their Model S cars, which sell for about $122,000 in China, were influencers such as Cao Guowei, CEO of Internet company Sina, and Yu Yongfu, chief executive of the mobile Internet browser company UCWeb, according to LA Times.

Tesla ever said that they would make the price “fair” in China. In fact, At least 800,000 RMB per car is a kind of rich people’s toy. For instance, Chinese automaker BYD’s all-electric e-6 car can be bought for under 400,000 RMB, and its model Qin for even less.

Tesla recently announced that they would produce a mass-market electric car” in three years. They are planning to build a large-scale factory that will allow it “to achieve economies of scale and minimize costs through innovative manufacturing, reduction of logistics waste, optimization of co-located processes and reduced overhead”.

At least, China still need more time to be ready for a big warm welcome for Tesla or other electric vehicle companies.


China’s E-commerce Giant Go to Public in US

Chinese e-commerce giant Alibaba on Tuesday filed for its long-awaited initial public offering, one of the largest in history.

Alibaba –described as eBay, Amazon and Google rolled into one – was evaluated at $150 billion to $200 billion. Its stock debut immediately gave it a higher market value than Facebook and Amazon.

It was estimated that the Hangzhou-based tech behemoth to raise $15 billion to $20 billion, exceeding Facebook’s record-breaking $16 billion IPO in May 2012.

Alibaba was founded in 1999 by Jack Ma, who was turned down for a number of jobs before starting his own e-commerce empire, including a manager post at a Kentucky Fried Chicken store.

Alibaba’s businesses include online shopping, business-to-business sales, online payments, shipping, wholesale trade and cloud computing. Alibaba’s retail marketplace last year processed 11.3 billion orders from 231 million active buyers for a total of $248 billion in purchases, more than the transaction volume on eBay and Amazon combined. On Singles Day in November, a popular holiday in China for online shopping, the company’s online retail portals processed $5.8 billion in spending. Alibaba earned net income reached about $1.4 billion last year with $5.6 billion in revenue.

While little known outside of China, Alibaba dominates the e-commerce market in the world’s second biggest economy. The company’s Taobao service has 800 million product listings from 8 million sellers. About 80 percent of all Chinese e-commerce transactions go through Alibaba.

The company also has strong U.S. ties. Yahoo owns a 22.6% stake in Alibaba. The IPO is great news for Yahoo investors and Yahoo shares rallied on that report. The Alibaba IPO filing followed the debut of Weibo , Chinese version of Twitter, which raised $286 million in April.

In the past few months, Alibaba invested $215 million in Mountain View mobile messaging service TangoMe, pouring $250 million into San Francisco ride-sharing app Lyft and $206 million worth of investment into ShopRunner, a delivery service for online purchases.

Alibaba has dropped billions of dollars to acquire other Chinese companies as well, including a $1.2 billion purchase last week of 16.5% share in China’s Youku and Tudou, Chinese equivalent to YouTube and Netflix.

However, Alibaba faces the challenge of convincing investors it will be a good buy.

The biggest concern has to do with transparency. People have suspicions about the way Chinese companies are operating, and they want know specific numbers and details about Alibaba’s books.

Analysts estimate the company could be worth $136 billion to $245 billion when it started to sell stocks, according to Wall Street Journal.

One key concern is where Alibaba’s core revenue growth is coming from and the company’s system for recording and reporting sales.