In early 1930s, Home Owners’ Loan Corporation (HOLC) was created as part of Roosevelt’s New Deal to reduce the down payment required to buy a house in hopes of promoting homeownership. The Congress then created the Federal Housing Administration, which sets standards for construction and underwriting and insures loans made by banks and other private lenders for home building, as well as insuring private mortgages. HOLC developed a system of maps that rated neighborhoods according to their perceived stability. On the maps, the areas rated “A” were marked in green areas. According to Ta-Nehisi Coates’ article in The Atlantic by, these areas were considered “in demand” neighborhoods that, as one appraiser put it, lacked “a single foreigner or Negro”. These neighborhoods were considered excellent prospects for insurance. Contrastively, neighborhoods where black people and other immigrants lived were rated “D” and were usually colored in red. This is where the term “redlining” comes from. Usually, these “D” neighborhoods were considered ineligible for FHA backing. FHA selectively granted loans to white neighborhoods and forbid the sale of properties in these green areas to anyone other than whites. The mortgage industry as a whole adopted these practices, and turned the maps into self-fulfilling prophesies. The inability to access capital in these “hazardous” redlined neighborhoods, lead to disrepair and the decline of these communities’ housing value, which in turn reinforced the redline designation. The deterioration of these neighborhoods also most likely also fed white flight and rising racial segregation. The federal government eventually retreated from the practice, and it was outlawed by the Fair Housing Act in 1968. Nevertheless, redlining left long-lasting, truly horrific consequences for black people, black families, and black neighborhoods.
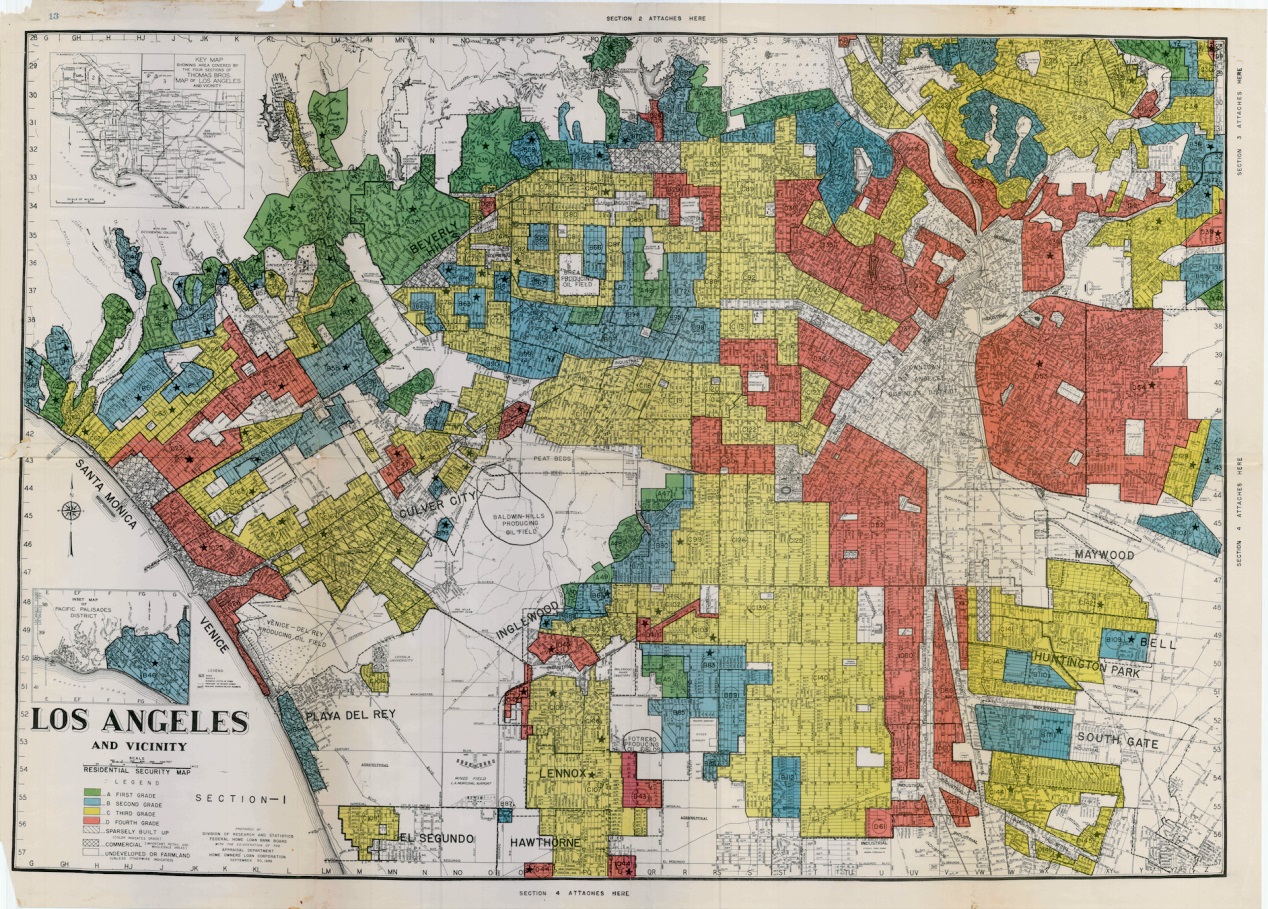
The Mapping Inequality project allows online access to the national collection of “security maps” and area descriptions produced by HOLC between 1935 and 1940. By looking at where the differently rated zones falls on the map, it becomes clear how present differences in the level of racial segregation, home-ownership rates, home values and credit scores reflects the old redlining boundaries. Today, these same communities still face predatory lending, or “retail redlining”, which inversely the proportion of Black residents to grocery stores, non-fast food restaurants, and other retail resources important for promoting and maintain health. According to a Pew Research project led by NYU Sociology professor Patrick Sharkey, to this day, Black people with upper-middle-class incomes do not generally live in upper-middle-class neighborhoods. Sharkey’s research shows that black families making $100,000 typically live in the kinds of neighborhoods inhabited by white families making $30,000. “Blacks and whites inhabit such different neighborhoods,” Sharkey writes, “that it is not possible to compare the economic outcomes of black and white children.
Sources:
Leave a Reply
You must be logged in to post a comment.