Gross domestic product growth can provide valuable information about the health of a nation’s economy, but it rarely goes any deeper than that broad lens. Disposable personal income is one way to indicate how people are doing on a more narrow level.
Disposable personal income is a measure of how much money families have once taxes are deducted from their paycheck. Disposable personal income is usually displayed in billions of dollars.
Disposable personal income shows how much people have left over, not just what they spent. If consumption is low but disposable personal is high it could mean people are putting more money towards necessities and/or saving.
This metric can also be compared to other indicators, like food prices, to determine what percentage of a person’s disposable personal income is being spent on necessities.
The USA Today said in a recent article that people are spending almost half of what they used to on food, which may mean that they are spending more of a percentage of their disposable personal income on other necessities, like housing and healthcare.
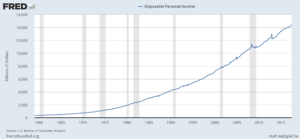
Disposable personal income has been on a steady upward trend since 1960 and before the great recession between 2008-2009 it briefly spiked from 10.8 trillion to 11.4 trillion (numbers adjusted for inflation). During the recession disposable personal income contracted.
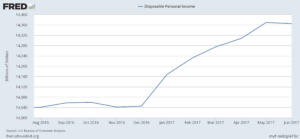
Since the recession, the trend moved upward, and in 2012 reached a sudden peak of 13 trillion. More recently, in 2017 disposable personal income contracted by around 4 billion.
2017’s lower numbers could account for stagnant wages, higher taxes and a number of other things.
Disposable personal income is a helpful economic indicator because it can be compared easily to other indicators and shows how the average person is doing in the economy. But as it is in the aggregate it leaves economic inequality out of the picture.


Leave a Reply
You must be logged in to post a comment.