In fact, the annual report shows that the median household income rose by 3.2% from $57,200 in 2015 to $59,039 in 2016, and that the percentage of people living in poverty decreased in 2016 by 0.8% from the rate registered in 2015. Additionally, the data reveal a drop in the percentage of people without health insurance coverage: the value registered in 2016 was 8.8%, 0.3% less than the value registered in 2015 (Reuters).

Overall the quality of life in the United States seems to be improving and this means that the growth that the country has seen since the recession in things like the stock market, is at least to a certain extent also starting to show in households (Marketplace). Yet, skepticism lingers over the data shown in the report.
Considering other measures could help to better understand why the U.S. still has much to do to repair its economy.
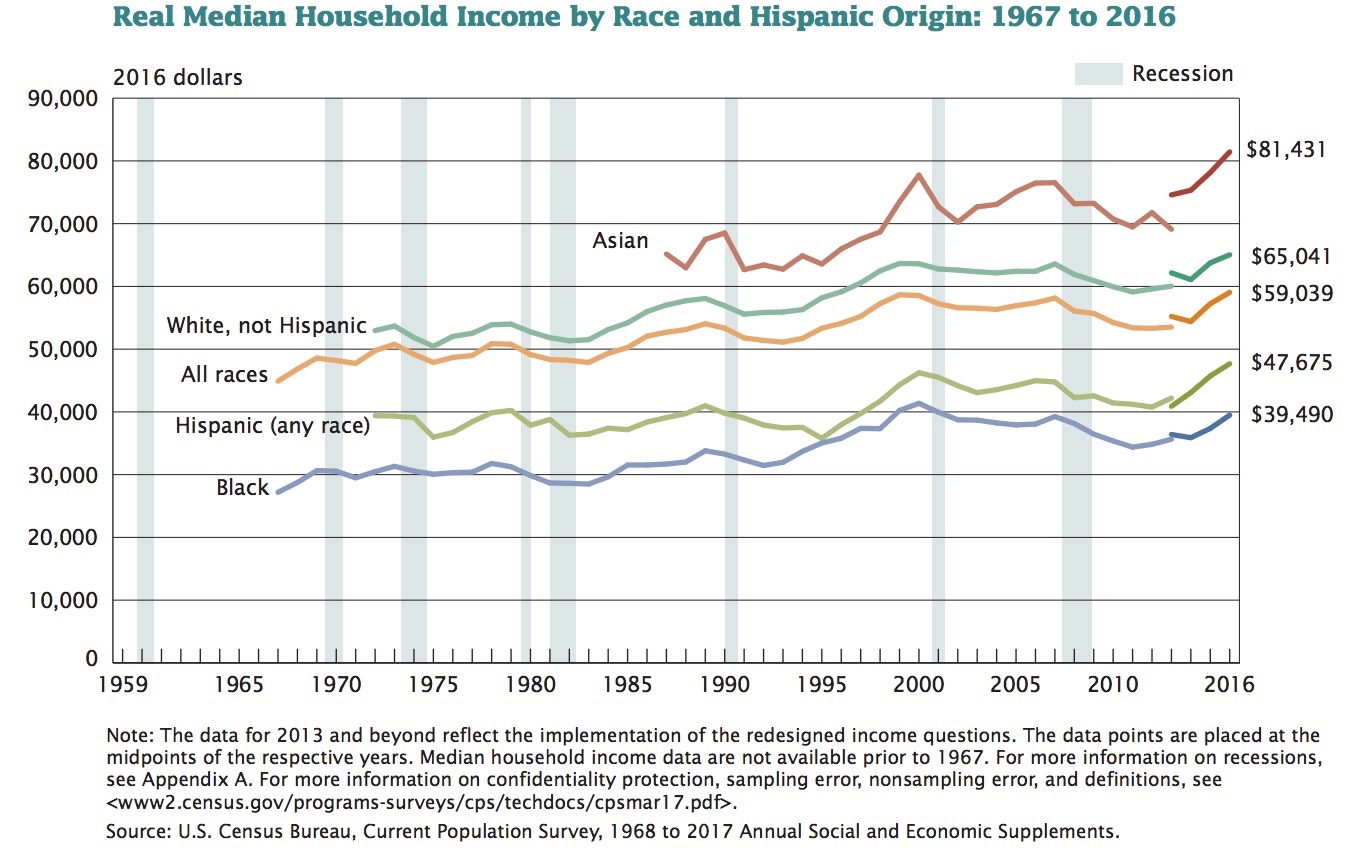
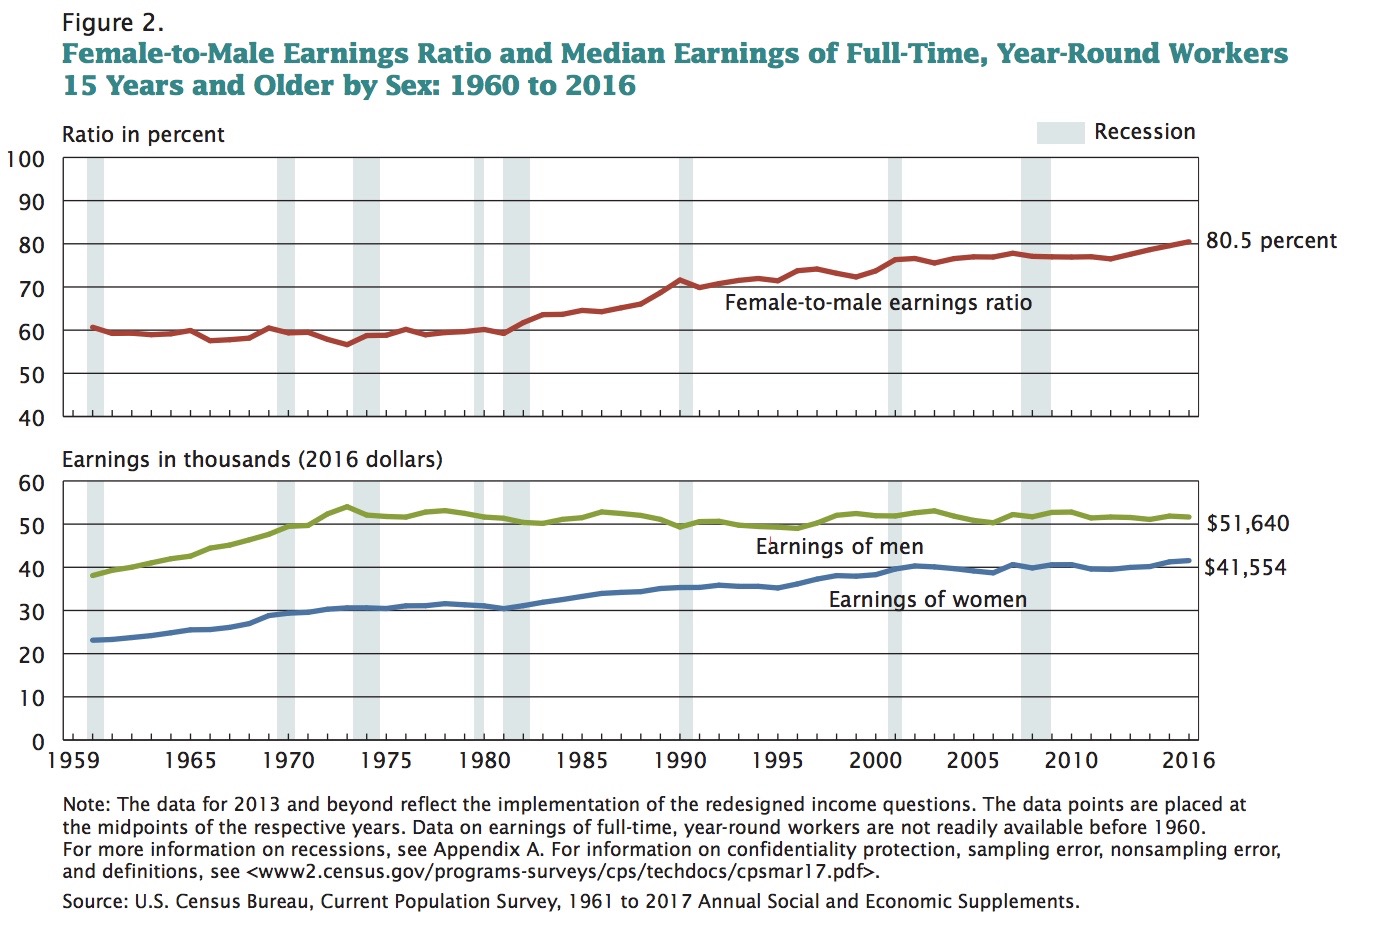
The report by the Census Bureau reveals that the income inequality rate is not decreasing: there are still huge divisions in incomes because of people’s gender, race and age. Moreover, inequality between Americans is growing (The New York Times).
In addition to income inequality, there is another measure that we should take into account: supplementary poverty. As pointed out by Forbes, unlike the poverty rate, supplementary poverty considers many of the government programs designed to assist low income families and individuals that are not included in the official poverty measure. Therefore, it shows that there are many families above the official poverty level that are actually receiving government aids.
This is one of the aspects that shows there are still many open questions about how economists should measure the poverty level and what values to take into account. Despite a rise in median household income, there are a lot of people who still feel «economic frustration», because there are different factors that influence people’s wages and economic opportunities, like for example the place where they live (Marketplace).
Beside these measures, also the number of health insurance coverages raises skepticism among the experts.
Even though the percentage of householders having insurance coverage increased, a breakdown of these data could reveal a different story.
If we look at people with income at or below the poverty level, we can see that 16.3% of them lack insurance coverage: «these are people who can least afford to take on medical debt» (Forbes). This percentage is quite remarkable when compared with the 4.6% of householders above the poverty level living without insurance coverage.
Despite these issues, it seems that the U.S. economy is improving overall. This element matters a lot, since President Donald Trump has announced that he wants to reform the current tax system and cut government spending. Democrats, considering the economic improvements shown in the Census Bureau’s report, «now have more ammunition to argue that the changes Mr. Trump seeks would mess with the success » (The New York Times).
The Federal Reserve is also paying close attention to the data released by the Census Bureau and to the current status of the U.S. economy. In fact, Janet L. Yellen, the Federal Reserve chairwoman, is expected to end the Fed’s lenient monetary policy in a meeting scheduled this week; the changes that will be following could affect the current improving U.S. economy.
Yet, whatever effect the new monetary policy will have on the economy, the increase in household income and the drop in the poverty rate is a reflection of the higher number of people back in the work force and of the 2.2 million of jobs added over the past year. The growth in the number of working people is «a vivid illustration of the old maxim that a job is the best antipoverty program » (The New York Times).
]]>
This is called the Garbage Index, which looks at the total amount of waste a country produces to measure the health and growth of its GDP.
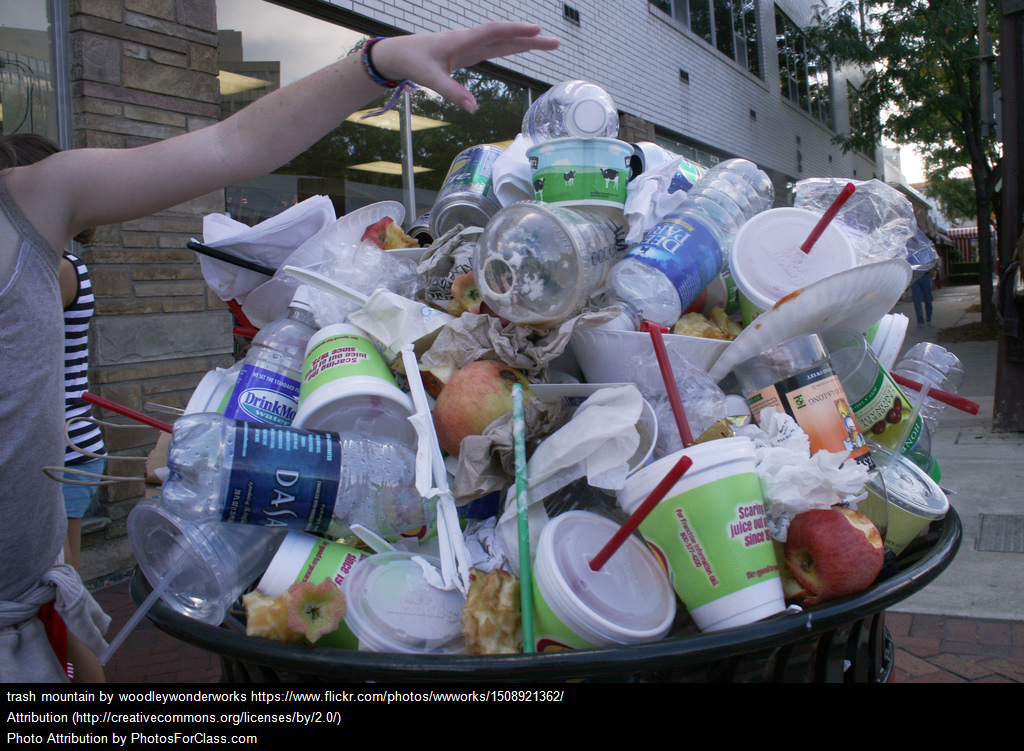
There are several reasons the amount of trash a country produces would correspond well to a country’s GDP. First, both are directly impacted by large and/or growing populations. The bigger a population, particularly of working age, the more consumers there are, the more trash they will likely produce. The consumption part is also key here, as the amount each person throws away reflects purchasing power and demand for products.
The amount a country is investing in certain projects — particularly those relating to real estate and commercial development — is also reflected in its waste. As economist Mark McDonough explained in an interview with Marketplace in 2012:
“It’s holistic because it’s not isolated to a single part of the economy. It’s people throwing things out, it’s buildings being demolished — it’s everything. … I mean, if you’re going to build a new building, there might be a building that’s already there.”
But while this indicator boasted an 82.4% correlation with the U.S. economy from 2001-2012, there are signs that indicate this relationship may not be so tightly bound going forward — particularly as attitudes towards waste change.
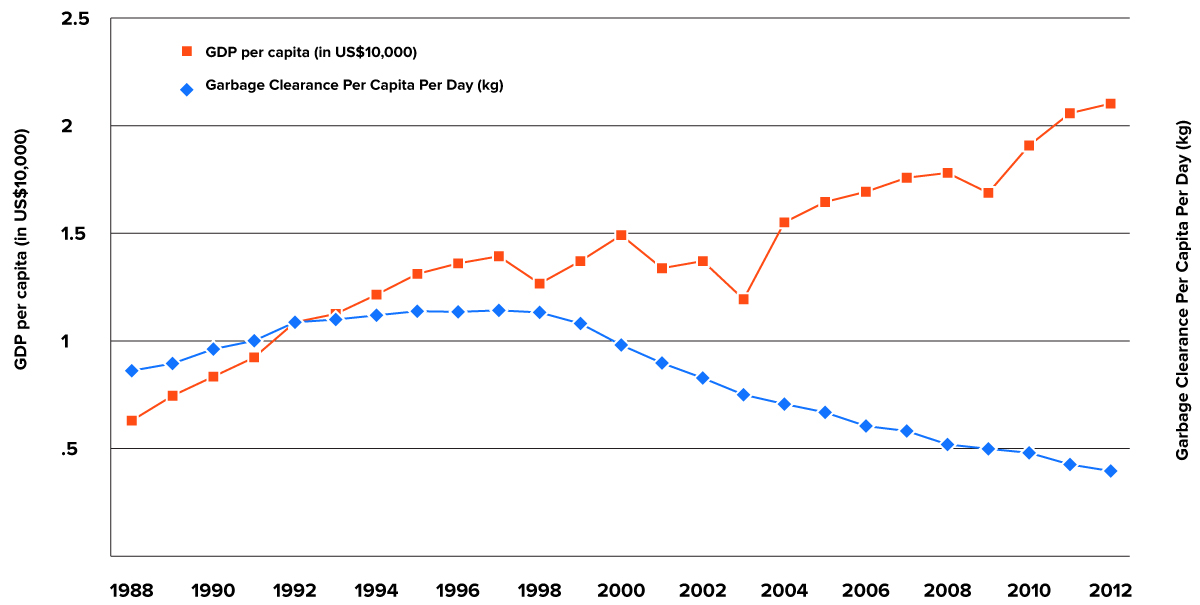
An article in GOOD magazine published late last year analyzes Taiwan’s evolving relationship towards waste — and how it is consciously separating the size of its GDP gains from the size of its landfills. Citing policies implemented in 1988, the Taiwanese government has been able to “decouple GDP growth and production of household waste over a period of about one generation.”
Taiwan has done this through a multi-prong approach that focuses on education (offering environmental lessons from everyone to school children and government officials) and urban planning (less garbage bins in public spaces are thought to make the Taiwanese more aware of the trash they are producing).
As of last year, Taiwan was approaching a robust $40,000 GDP per capita. Meanwhile, the average Taiwanese citizen also produced less than a kilogram of trash per day. Compare this to the average American, who produced roughly two kilos — that is, four pounds — of trash per day.
The following graph, published in the same article, dramatically illustrates the way this relationship has broken apart.
Finally, some economists suggest that the amount that we are capable of consuming has simply plateaued. Numbers from 2012 indicate that municipal waste and car usage have been either steady or on the decline in the U.S. and other developed countries.

However, China is a notable exception. This trend also is not true of other emerging economies.
The article’s author, Fred Pearce, expands on this:
“Even if peak stuff is reached soon, it will only apply to the billion or so people living in rich countries out of the global population of 7 billion. Achieving worldwide peak stuff, critics argue, would require heading off rising demand in the developing world, while seeing a much more sustained fall in consumption among richer nations.”
Currently, there isn’t evidence to support the idea that emerging economies will cease demanding more goods, services, and development — particularly when the idea of “stuff,” and lots of it, is so closely tied to the image of economic prosperity. As the middle class continues to grow throughout Asia and Africa, so will the waste they leave behind. The effects of this waste on the environment clearly present new challenges, both locally and globally, that must be dealt with by citizens, businesses and governments alike.
So, while today’s piles of garbage signal sound economic health for investors and economists, the relationship between garbage and GDP is one the more environmentally conscious among us would like to see laid to waste.
]]>